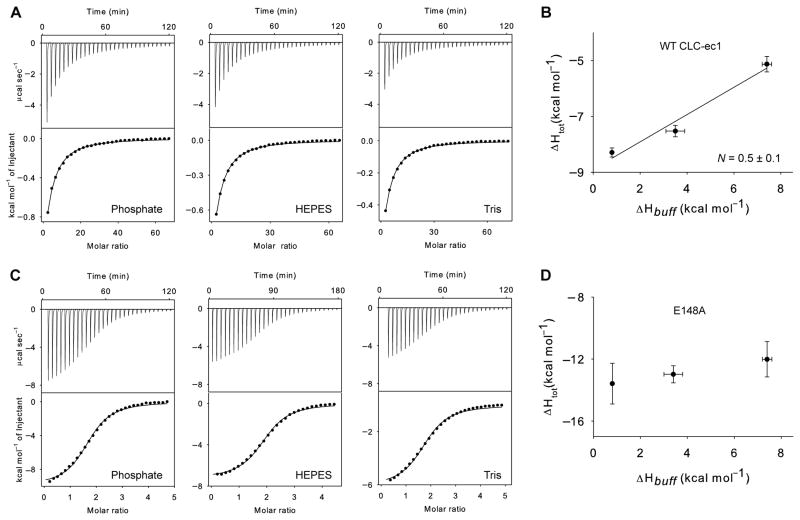
Fig. 4. Synergistic binding of Cl− ions and H+ to wild type CLC-ec1 (A and B) and to E148A mutant (C and D).
ITC data for Cl− binding (A and C) in phosphate, HEPES, or Tris buffers. In all experiments buffers were supplemented with 5 mM n-decyl-β,D-maltopyranoside Binding heat rates following baseline subtraction (top) and integrated binding heats (bottom) are shown. The solid lines through the data are fits to a single binding site model. The enthalpy of Cl− binding is plotted as a function of buffer ionization enthalpy (B and C). Error bars are standard errors of the mean. The solid black line in B is a linear fit with slope N = 0.5 ± 0.1. Figures are adapted and modified from Picollo, et al. (12).

