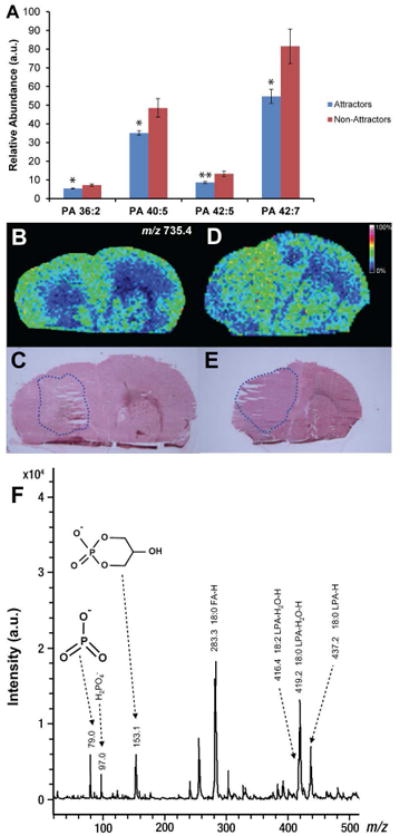
Figure 2. Negative ion MALDI-IMS of PA in GSC xenografts.

(A) Relative abundance of PA (36:2), PA (40:5), PA (42:5), and PA (42:7) as determined by ESI-MS/MS. Values are mean ± SEM (n = 9 for each phenotype) of the lipid abundance as the ratio of lipid peak area to the peak area of an internal standard corrected for protein concentration; *p < 0.05 and **p < 0.01 (Student's t-test). (B) Negative ion image derived from MALDI-IMS experiments of a representative attractor demonstrating the low signal intensity of PA (36:2) (m/z 735.4). Color intensity of the ion micrographs corresponds to signal strength. (C) H&E staining of corresponding tissue section used in MALDI-IMS experiment. Tumor area is outlined in blue. (D) Negative ion image derived from MALDI-IMS experiments of a representative non-attractor demonstrating the distribution and signal intensity of m/z 735.4. (E) H&E staining of corresponding tissue section used in MALDI-IMS experiment. Tumor area is outlined in blue. (F) Annotated MS/MS spectrum of PA (36:2) suggesting isoform PA (18:0/18:2). MS/MS product ions are shown in Table 1.
