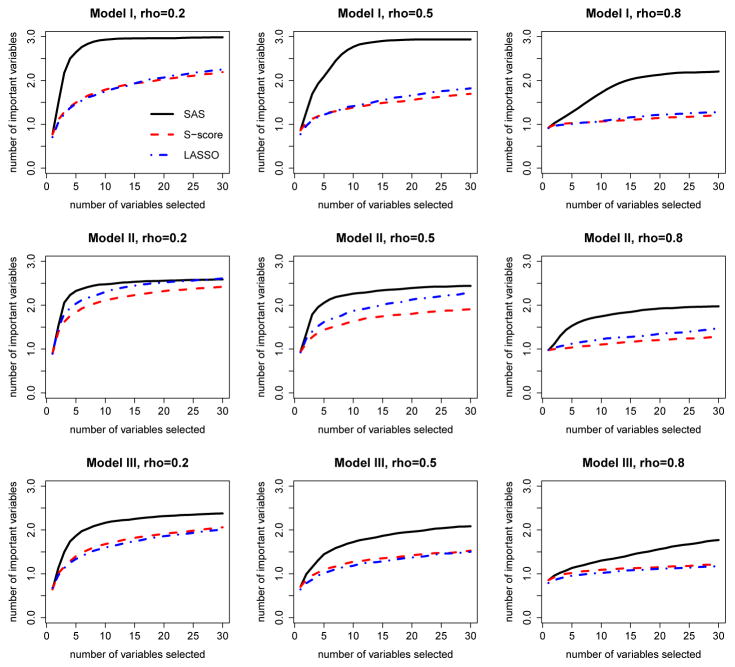
Fig 2.
Solution path of sequential advantage selection (SAS), S-score and LASSO methods. These plots are from the randomized study with the first choice of β (three important prescriptive variables: X1, X9 and X10), and are given for all combinations of three baseline functions and three choices of correlations of covariates. Black solid line: SAS method; Red dashed line: S-score method; blue dot-dashed line: LASSO method.

