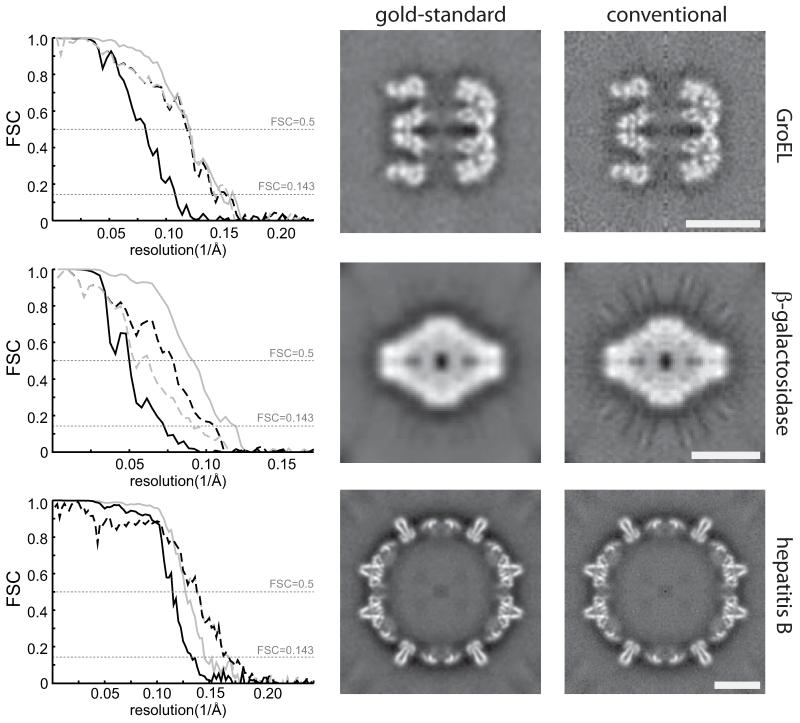
Figure 1. The prevention of overfitting.
Tests with three cryo-EM data sets (GroEL, β-galactosidase and hepatitis B) illustrate that overfitting may be avoided without compromising resolution. FSCs between reconstructions from random halves of the data (solid lines) and FSCs between the reconstruction from all particles and the crystal structures (dashed lines) show that the gold-standard procedure (black) does not yield lower resolutions, while the conventional procedure (grey) over-estimates resolution (left column). The frequency where the dashed lines pass through FSC=0.5 indicate the true resolution of the reconstructions from all particles, whereas the frequency where the solid lines pass through FSC=0.143 indicate the reported resolution8. Corresponding values are given in Supplementary Table 1. Central slices through the reconstructions for the gold-standard procedure show less noisy maps with fewer artefacts (middle column) than for the conventional procedure (right column). Scale bars (white) correspond to 100 Å.

