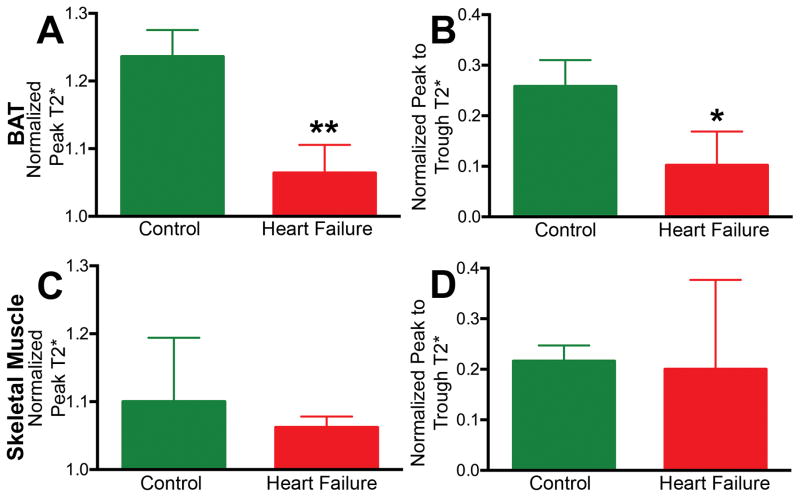
Figure 3. Metabolic response in BAT differs from skeletal muscle.
In BAT, significant differences were seen between control and heart failure mice in (A) normalized peak T2* after CL injection and (B) peak to trough T2*. (C, D) In skeletal muscle, these parameters did not differ significantly between the control and heart failure mice. (* p < 0.05, ** p < 0.01). BAT = Brown Adipose Tissue, CL = CL 316,243.

