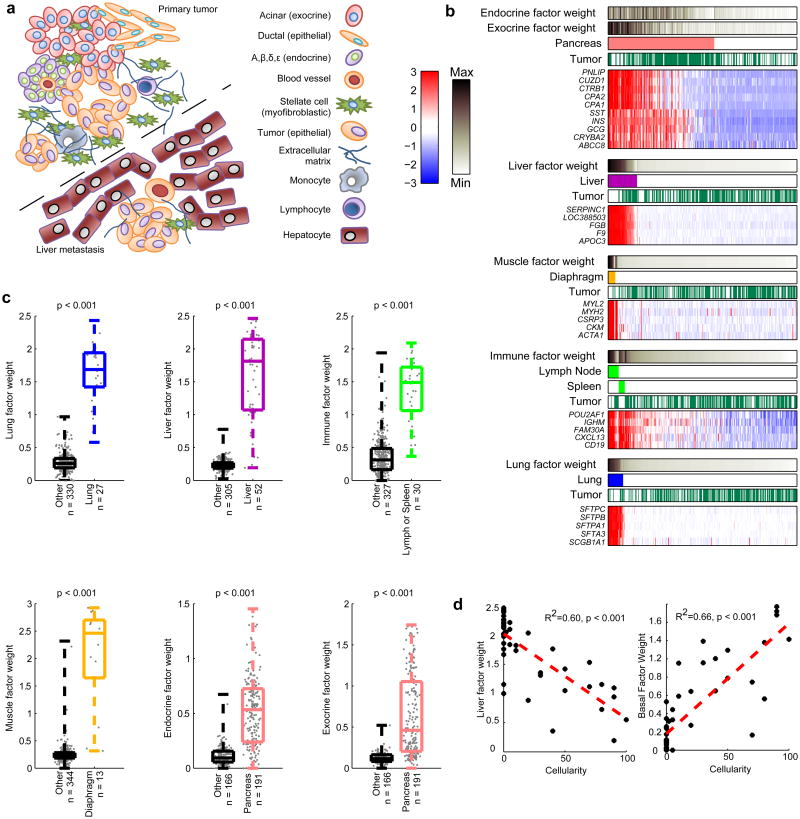
Figure 1.
Successful Deconvolution of Normal Tissue with NMF. (a) Cartoon depicting the major cell types in primary tumor and liver metastasis samples. (b) (above) Overlap of sample types (solid colors) with factor weights (grayscale heat maps), and (below) heat maps of five exemplar genes for all tumors and adjacent normal tissues. Gene expression shown in the heat map has been Z-normalized. (c) Box and whiskers plots showing median, quartiles, and range comparing NMF factor weights across tissue types and corresponding t-test result. (d) Percent tumor cellularity versus NMF liver factor weight, and NMF basal tumor factor weight for metastases to the liver and adjacent liver samples. Linear regression lines are shown in red along with corresponding statistics.

