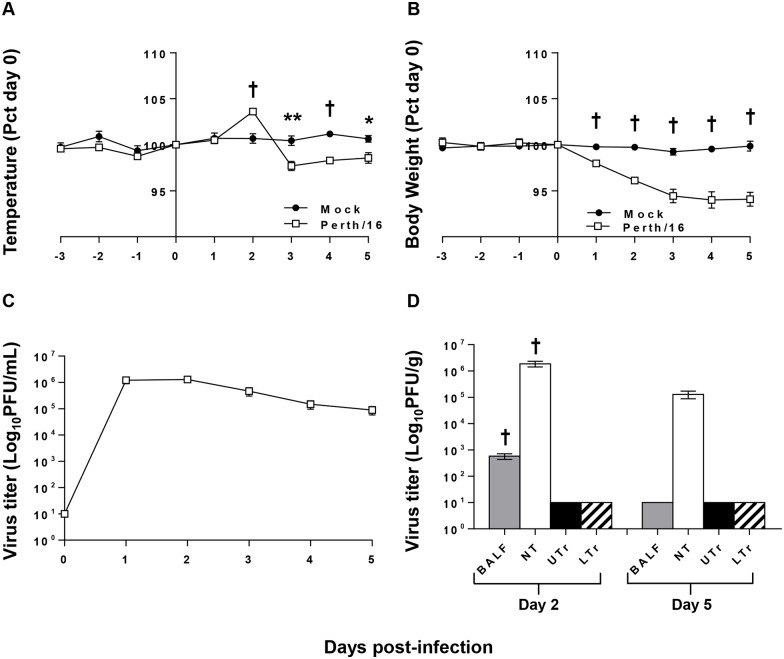
Fig 2. Clinical responses to infection.
To measure morbidity the temperature (A) and body weight (B) readings of infected and control ferrets were recorded daily (days -3 to 5). Data shown are normalized to the individual animals’ weight or temperature on the day of challenge (day 0), and group averages are reported. “Mock” ferrets were infected intranasally with sterile egg allantoic fluid; “Perth/16” ferrets infected intranasally with 1 x 10⁶ pfu of A/Perth/16/09. The nasal cavities of all ferrets were washed daily with 1ml of PBS on days 0–5; and viral titers in the nasal washes (C) were determined. In addition, viral titers were determined in tissues (D); BALF, nasal turbinates (NT), upper trachea (UTr), and lower trachea (LTr). A p value of 0.05 was used as the cutoff for statistical significance (* p ≤ 0.05; ** p ≤ 0.01; † p ≤ 0.001). Error bars represent SEM.

