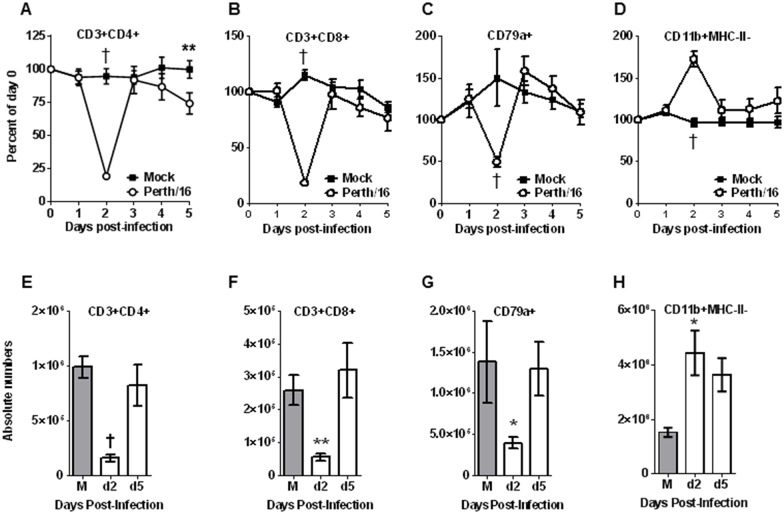
Fig 4. Peripheral blood leukocyte subsets following infection.
Ferrets were bled on days 0–5 relative to the day of viral challenge, and cells were stained and analyzed by flow cytometry as described in the text. Percentage and absolute number of TH (CD3+ and CD4+), Tc lymphocytes (CD3+ and CD8+), B cells (CD79a+) and CD11b-positive cells were measured (A-H). For each animal the frequencies were normalized to the ferret’s values on day 0; the Y axis represents percent of values on day 0. Group averages are reported here. “Mock” ferrets were infected intranasally with sterile egg allantoic fluid; “Perth/16” ferrets infected intranasally with 1 x 10⁶ pfu of A/Perth/16/09. For mock animals (M), absolute number of same cell subsets were measured at day 5 post-challenge and for the infected animals at days 2 and 5 post-challenge. A p value of 0.05 was used as the cutoff for statistical significance (* p ≤ 0.05; ** p ≤ 0.01; † p ≤ 0.001). Error bars represent SEM.

