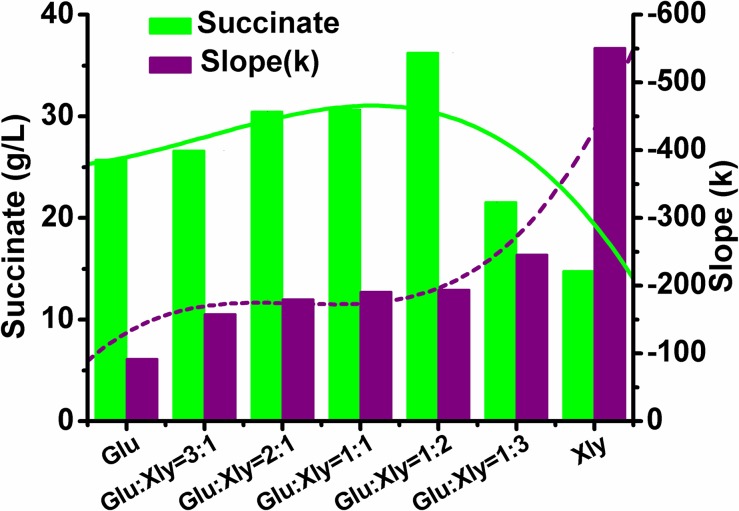
Fig 3. Relationship among succinate production, sugar ratio and intracellular ATP level.
The ATP level was shown as the slops of their ATP regression lines which represented the specific rate of ATP consumption in units of nmol/(g CDW)/h. The solid and dashed lines were the second order polynomial regression line calculated by Origin Pro 8.0.

