
Fig 4. Gene set enrichment map of RNA-seq data using the ‘GO_slim’ yeast ‘molecular_function’ ontology.
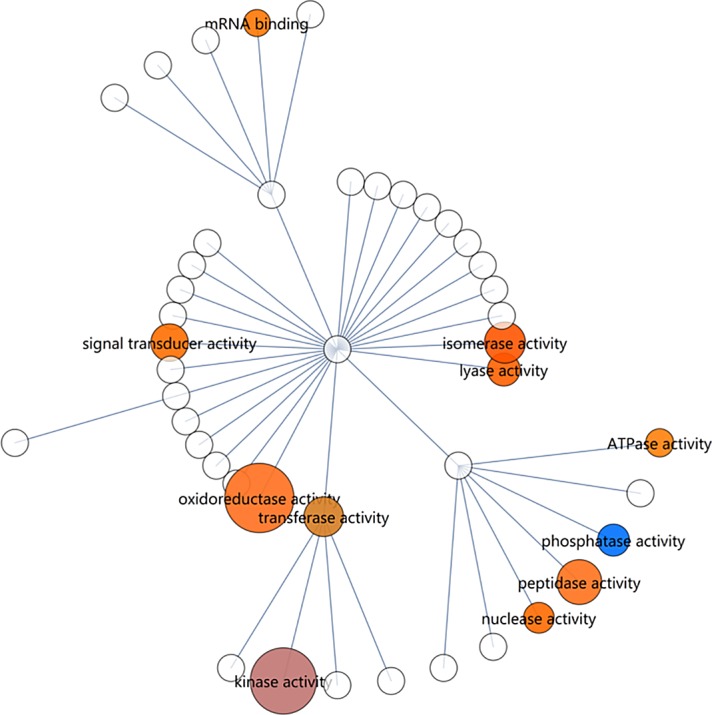
Size indicates the enrichment score of a gene set. Colour indicates the up/down direction of regulation: Red, up; blue, down. Brightness rises with the fraction of genes that are regulated in the dominant direction (up or down). Only nodes larger or equal than ‘peptidase activity’ are significant.