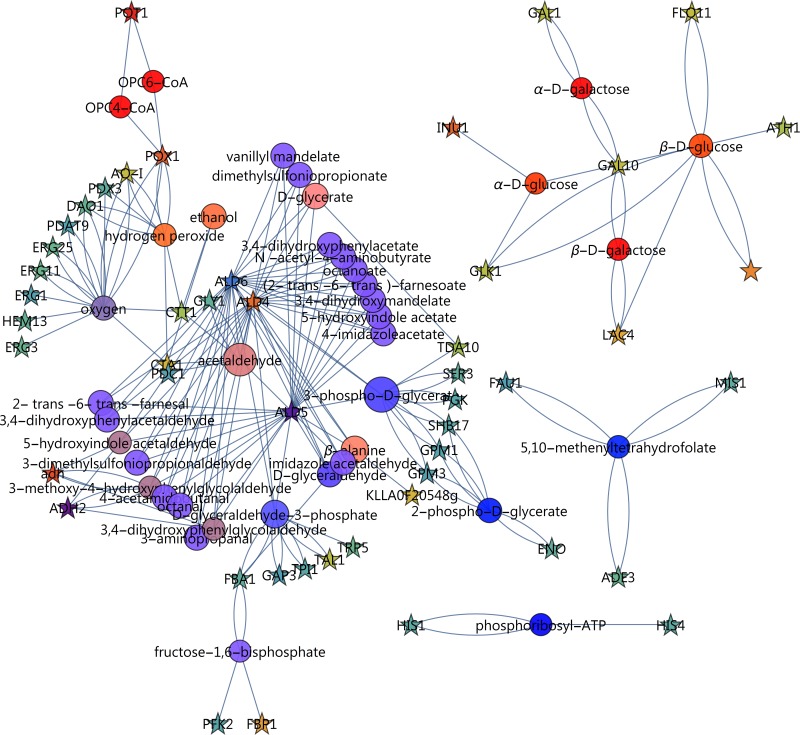
Fig 8. Reporter metabolite-enzyme network, capturing enriched reporter metabolites and the enzymes that affect them.
Only reporter metabolites with enrichment values above 3.0 were included and only the differentially expressed genes from RNA-seq with q-values (corrected p-values) below 0.05. For reporter metabolites (circles), size indicates the enrichment score of a gene set and colour indicates the up/down direction of regulation. Brightness indicates uni-directionality of regulation. For enzymes (stars), colour indicates the up/down direction of regulation based on the log2(fold change) scheme. Reporter metabolite enrichment values are represented in S1 Table. (For full information on gene names, the interactive file S3 Network or the corresponding annotations in S1 Table, using the “Gene names (primary)” column, may be consulted.)

