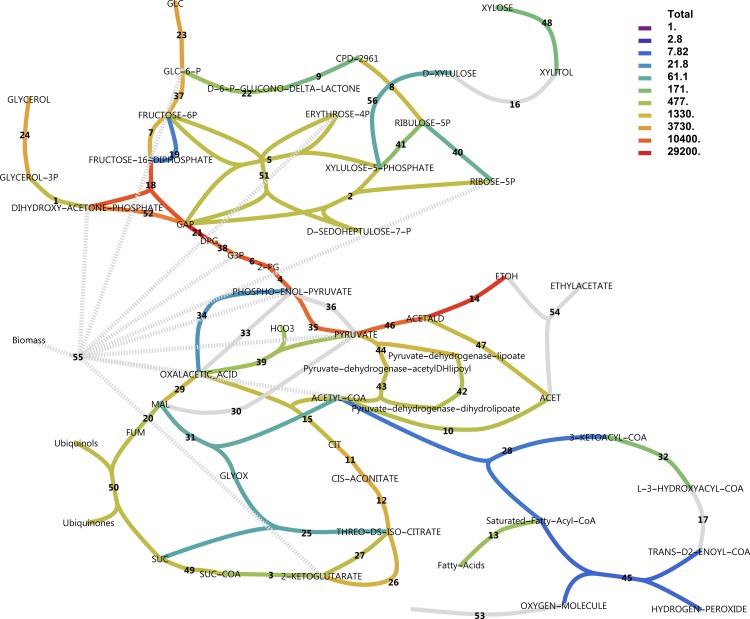
Fig 10. Total transcript levels in central metabolic pathways with glucose as the carbon source.
Transcript levels for all genes catalysing a reaction were summed. Note the logarithmic scale. Dark grey indicates genes present and constitutively expressed. Light grey indicates genes not found in annotation or combined reactions. For reaction names, see S1 Pathway.

