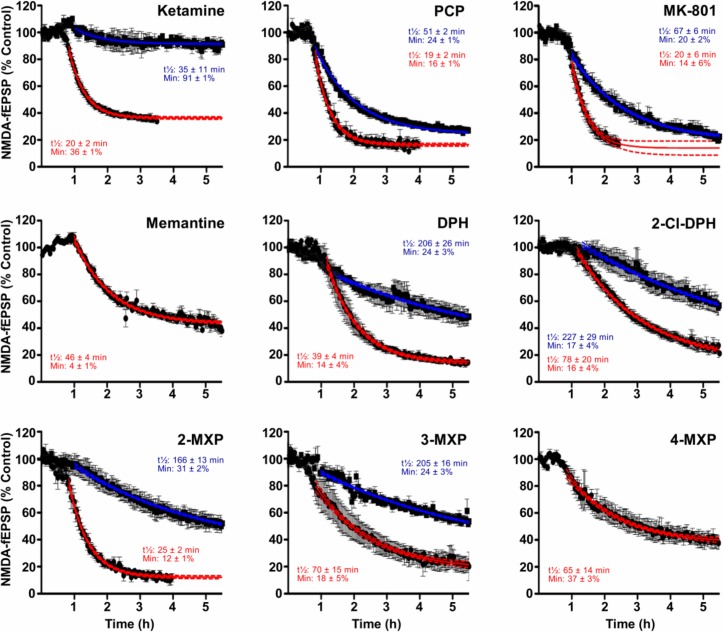
Fig 4. Graphs showing the time course of reduction of the NMDAR-fEPSPs by nine compounds.
Each graph shows the average fEPSP amplitude of 3–5 experiments expressed as a percentage of the amplitude during the prior baseline recording. Drugs were added to the aCSF at concentrations of either 1 μM (blue) or 10 μM (red). The figures on the graphs give i) the time to reach half the maximal response for each drug concentration and ii) the maximal effect; values derived from single exponential curve-fitting. In the case of memantine and 4-MXP only the 10 μM concentration was tested.

