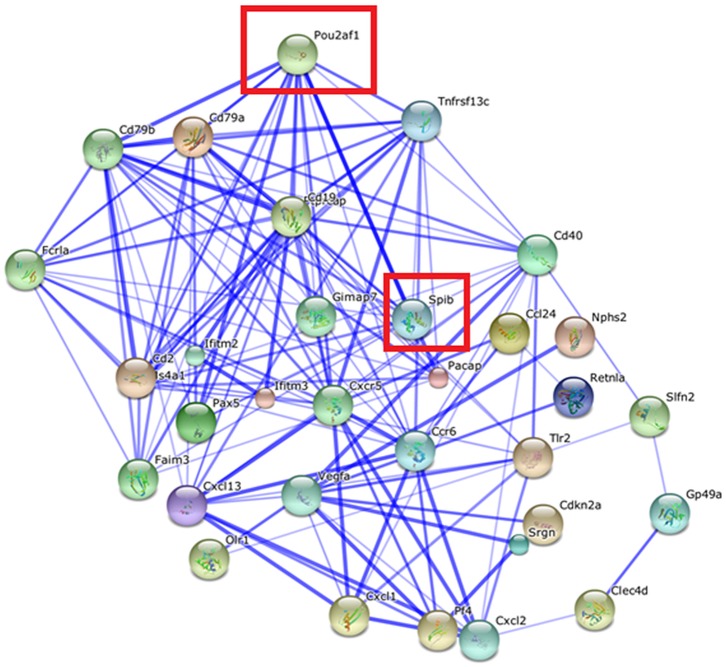
Fig 6. Network of genes under-expressed in microglia relative to macrophages in wild type mice (|log2(fold change)| >|6, FDR-adjusted P-value < 5.0 x 10⁻⁵) visualized using STRING.
Edges represented by thicker lines denote stronger associations than thinner lines. Node size reflects the structural information associated with the protein coded by the gene. The node color facilitates visualization. Framed genes (red square) are discussed.

