Fig 6.

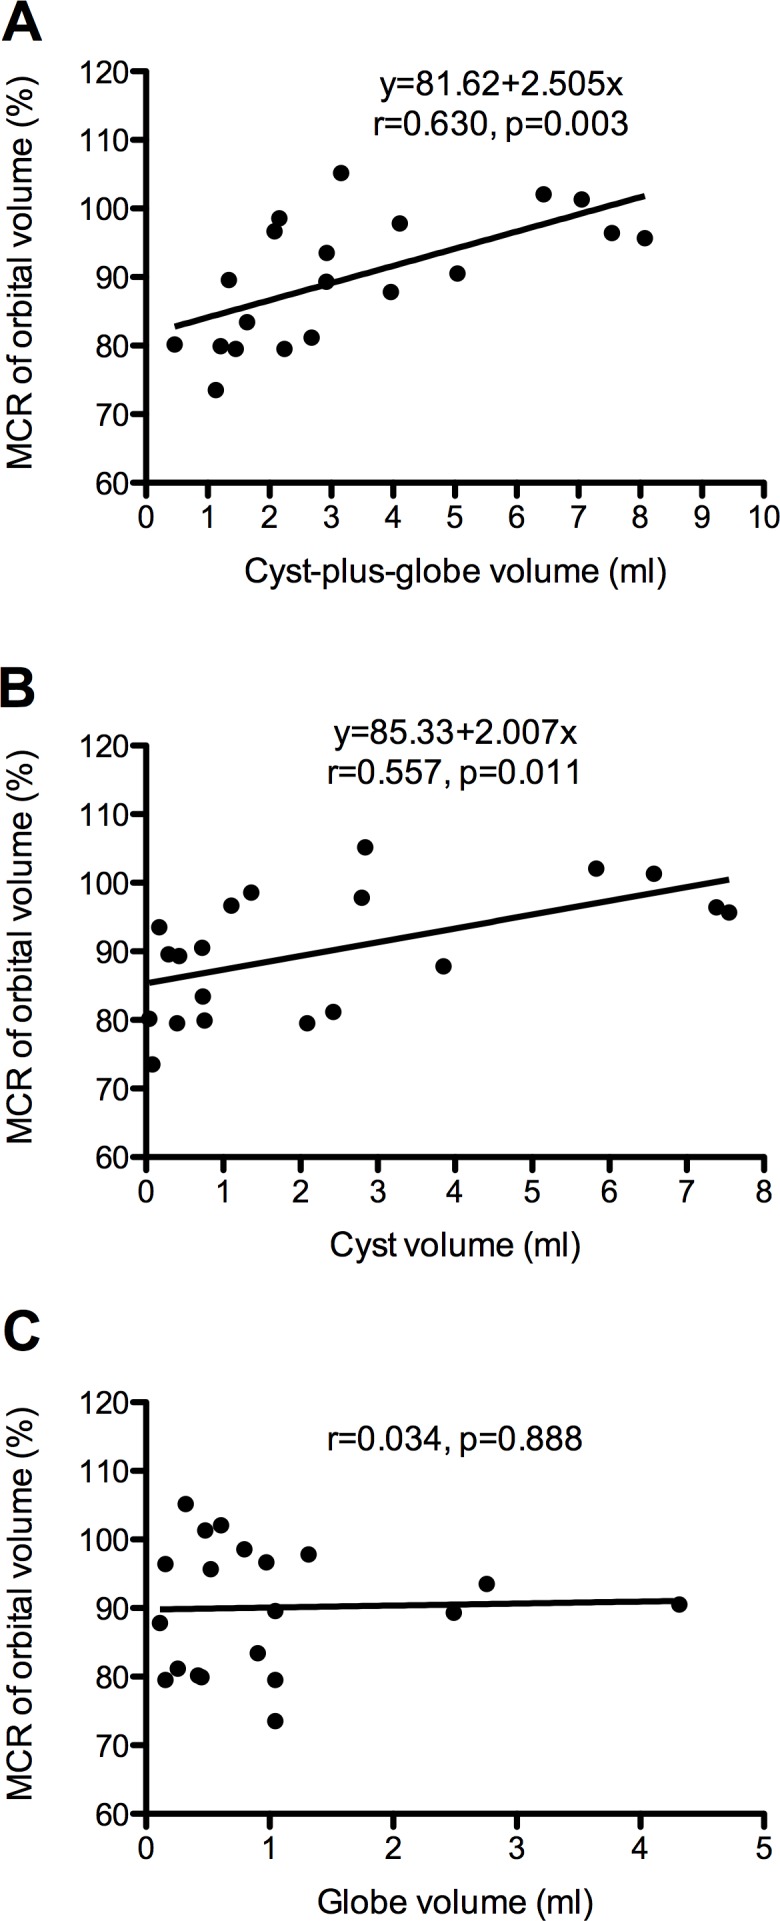
Scatterplots showing the correlations between cyst-plus-globe volume (A), cyst volume (B), globe volume (C) (x-axis) and MCR of orbital volume (y-axis). The linear regression line (black line) was modified from the two variables.

Scatterplots showing the correlations between cyst-plus-globe volume (A), cyst volume (B), globe volume (C) (x-axis) and MCR of orbital volume (y-axis). The linear regression line (black line) was modified from the two variables.