
Fig 6.
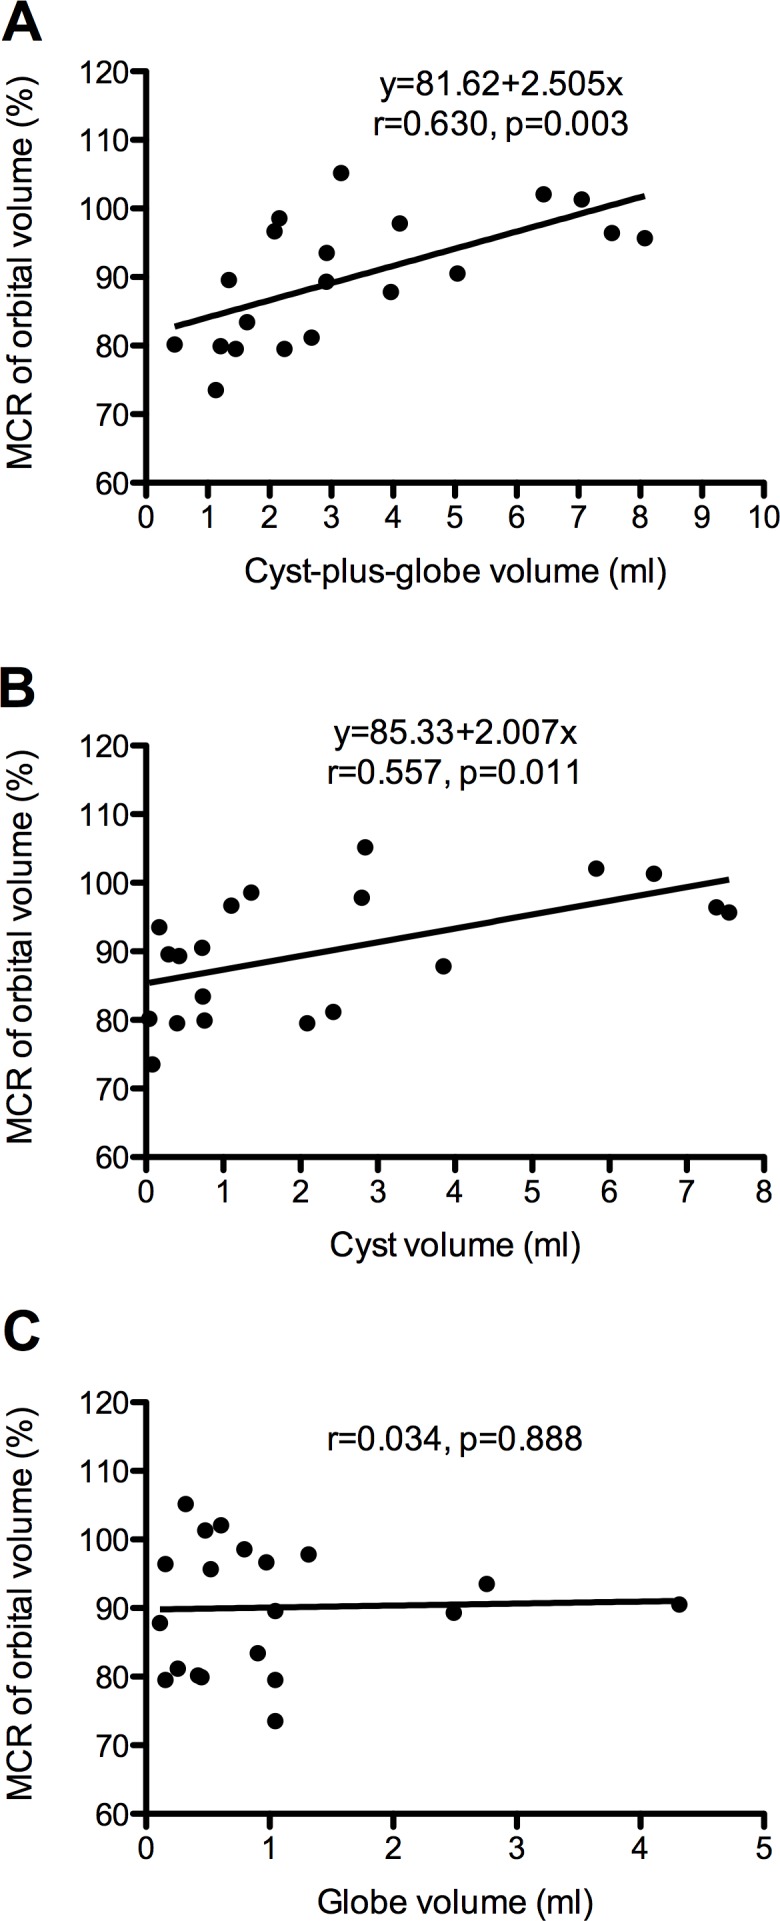
Scatterplots showing the correlations between cyst-plus-globe volume (A), cyst volume (B), globe volume (C) (x-axis) and MCR of orbital volume (y-axis). The linear regression line (black line) was modified from the two variables.
Official websites use .gov
A
.gov website belongs to an official
government organization in the United States.
Secure .gov websites use HTTPS
A lock (
) or https:// means you've safely
connected to the .gov website. Share sensitive
information only on official, secure websites.
Scatterplots showing the correlations between cyst-plus-globe volume (A), cyst volume (B), globe volume (C) (x-axis) and MCR of orbital volume (y-axis). The linear regression line (black line) was modified from the two variables.