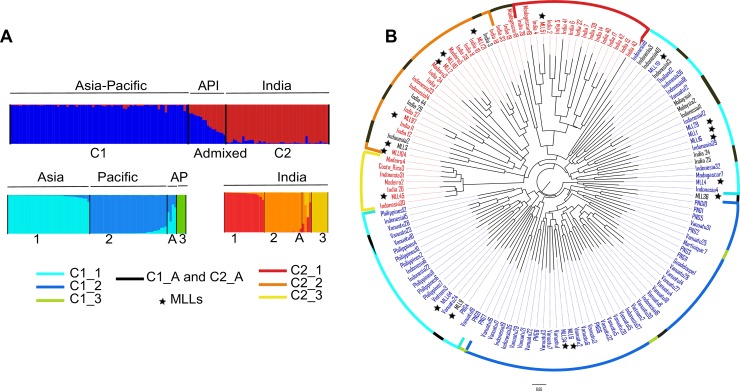
Fig 2. Genetic relationships and Genetic structure of the 136 genotypes (UGs and MLLs).
(A) Unrooted neighbor-joining tree, based on 11 microsatellite markers, using Dice distance, showing genetic relationships among 136 genotypes. Each node label is colour-coded according to membership in the two clusters C1 and C2 identified by STRUCTURE. Genotypes assigned to admixed groups are shown in black. Outer circles are colour-coded according to sub-clustering within Clusters 1 and 2. Genotypes assigned to admixed groups after sub-clustering are shown in black. (B) Cluster assignment of 136 taro genotypes estimated using STRUCTURE for K = 2 and sub-cluster within each cluster for K = 3. The genome of each individual is represented by a vertical line, which is partitioned into K colored segments that represent the admixture coefficient, i.e the estimated proportion of membership of its genome in each of the K clusters. API: Genotypes from Asia, Pacific and India. AP: Genotypes from Asia and Pacific. 1, 2, 3 and A: Sub-clusters and admixed genotypes within each cluster C1 and C2.

