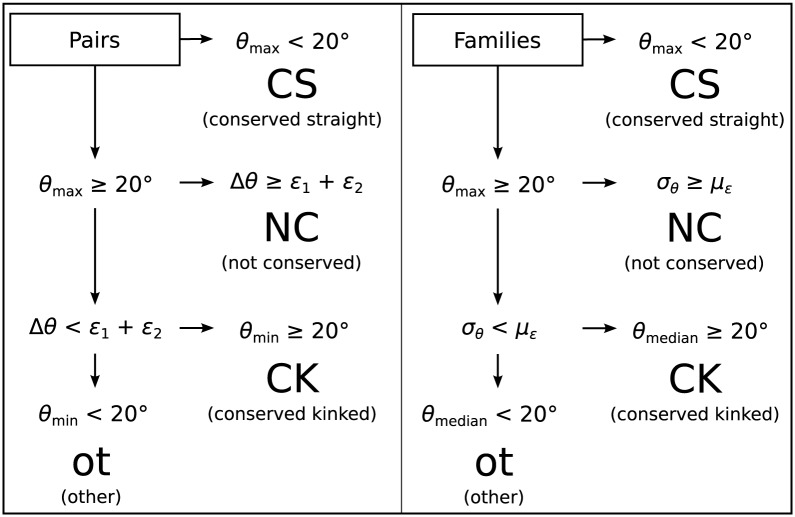
Fig 1. Flowchart showing the classification of homologous helix pairs and families.
Pair classification uses the angles of the two helices at the most disrupted site (θmax, θmin), angle difference (Δθ) and the error on each angle (ϵ). Family classification uses analogous statistics to obtain the same classes: the median angle (θmedian), standard deviation (σθ), and mean error (μϵ) of the angles in the family.

