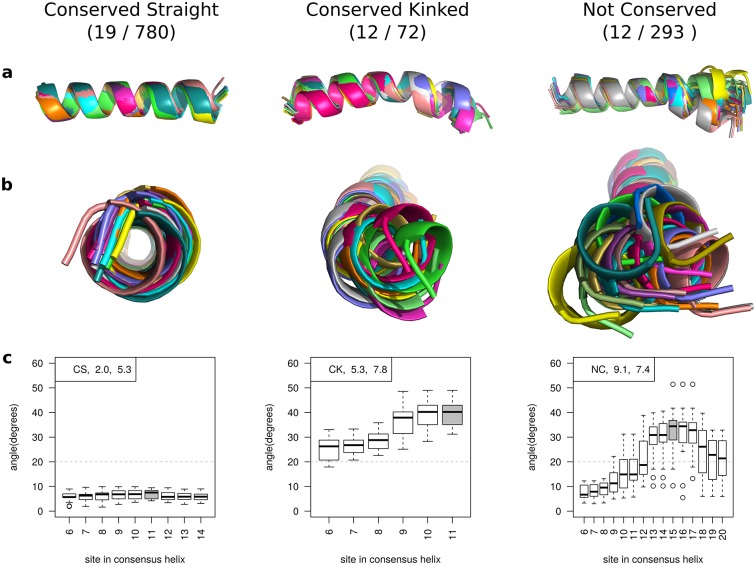
Fig 4. Illustrations of a homologous helix family from each of the three main classes.
The number of families in each class is shown in brackets (membrane set / soluble set). 113 out of 1,258 soluble families and 2 out of 45 membrane families were classified as ‘Other’. (a) and (b) Side and top view of helices in a family superimposed by aligning the residues prior to the kink site. (c) Boxplots to show the variation in angle after smoothing at each site in the helix. The grey box indicates the site of maximum disruption used to classify the helix (see Methods). In the top left of each graph, the classification, σθ (standard deviation of angles), and με (mean error) of the most disrupted site is given.

