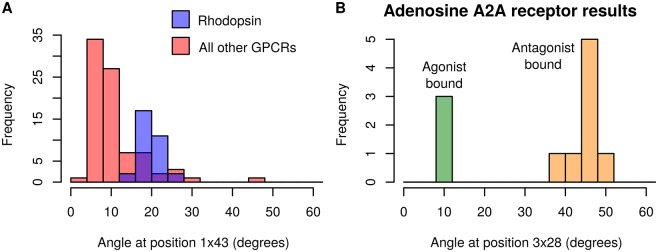
Fig 7. Bimodal angle distributions.
A) Angle distribution at position 1x43 in all GPCR structures. Angles from rhodopsin structures are shown in blue (n = 32); angles from all other structures shown in red (n = 83). B) Angle distribution at position 3x28 in the human adenosine A2A receptor. Agonist-bound receptors are shown in green (n = 3); antagonist-bound receptors in orange (n = 8). Fig M in S1 Document displays the errors for the angle data from both histograms.

