
Figure 1.
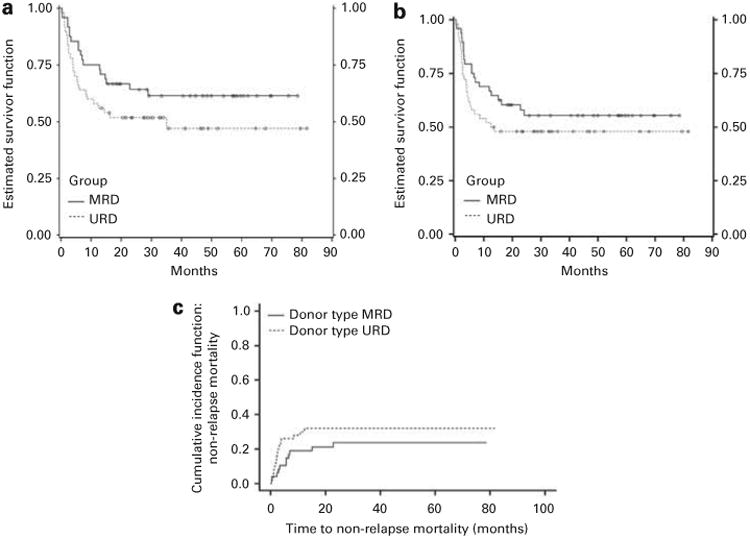
(a) K-M survival curves depicting OS in patients conditioned with or without ATG (log rank P = 0.13). (b) K-M survival curves depicting EFS in patients conditioned with or without ATG (P = 0.25). (c) Cumulative incidence curves depicting non-relapse mortality in patients conditioned with or without ATG (P = 0.28).