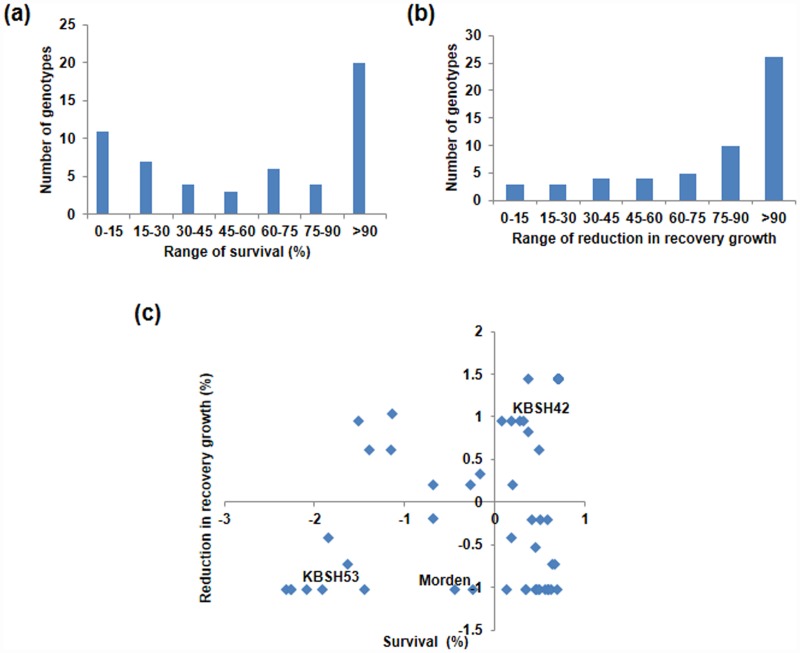
Fig 3. Genetic variability of sunflower genotypes under menadione-induced oxidative stress.
Frequency distribution of genotypes based on survival (%) (a) and, reduction in recovery growth (%) (b) and seedlings were classified using Z- distribution analysis for the 55 genotypes (c). The first and fourth quadrant indicates susceptible and resistant genotypes respectively. The seedlings were exposed to acclimation stress of 1 mM menadione at 30°C and subsequently exposed to a higher concentration of menadione.

