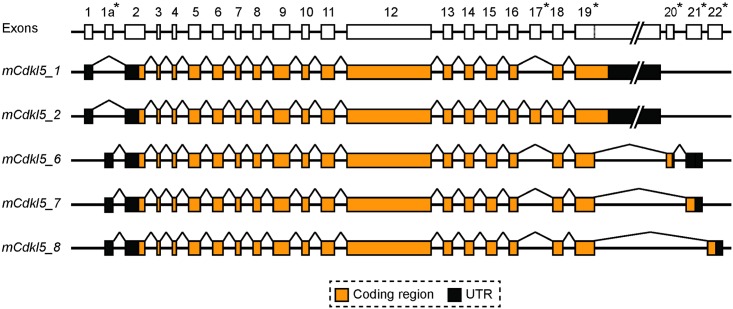
Fig 4. Mouse Cdkl5 gene and transcript isoforms.
Diagram depicting the structure of the mouse Cdkl5 gene and the exon composition of the five different coding isoforms (mCDKL5_1, _2, _6, _7, _8). Lines linking exons indicate splicing events. Asterisks next to exon numbers indicate where differences are found between different transcript isoforms. Dotted lines within exons indicate alternative splice sites. Introns and the 3’-UTR portion of exon 19 are not drawn to scale.

