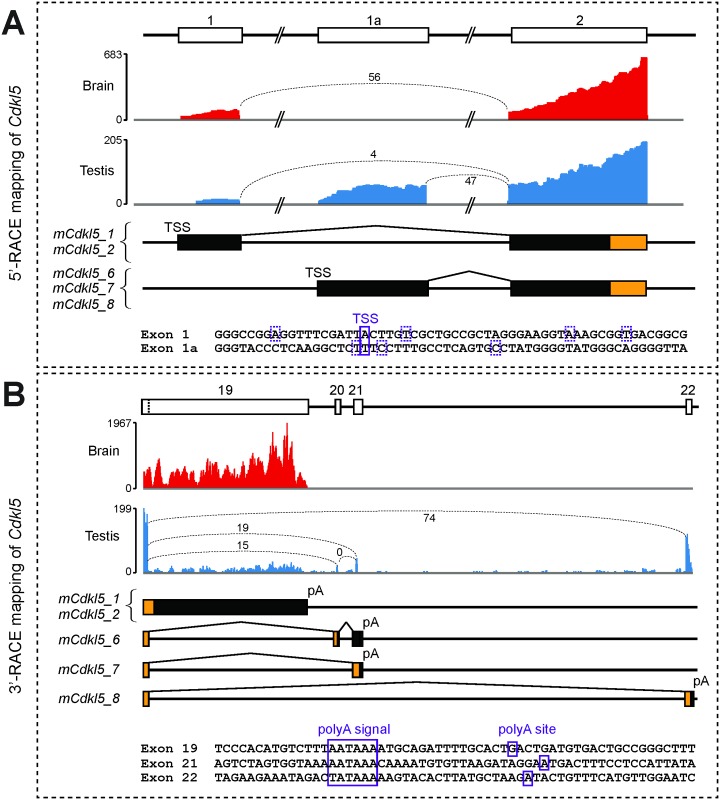
Fig 6. RNA-seq and 5’ and 3’-RACE mapping of mouse Cdkl5 transcripts.
(A) Upper panels: RNA-seq data from brain (red) and testis (blue) datasets show reads mapping to the 5’ end of Cdkl5 (the y-axis indicates read count across the analysed region). Indicative numbers of RNA-seq reads spanning each exon junction are also shown, indicated by values and dotted lines joining exon boundaries. Middle panels: boxes representing each exon at the 5’ end of the gene are shown, aligned with those in the upper panels. Transcription Start Sites (TSSs) and splice events upstream of exon 2 are indicated. Coding regions are indicated by orange colouring and 5’-UTRs by black colouring. Lower panel: exonic sequences for each first exon are shown. TSSs, confirmed by sequencing of 5’-RACE products, are indicated by boxes; the major TSS is indicated by a solid box, minor TSSs are indicated by hatched boxes. (B) Upper panels: RNA-seq data from brain and testis datasets show reads mapping to the 3’ end of Cdkl5; exon boundary-spanning red counts are also shown, as in (A), above. Middle panels: the exon composition and splicing patterns at the 3’ end of each mouse isoform is shown, colouring as in A) above. Lower panel: sequences around each of the three polyadenylation signals and sites (pA) are shown; each was confirmed by sequencing of 3’-RACE mapping.

