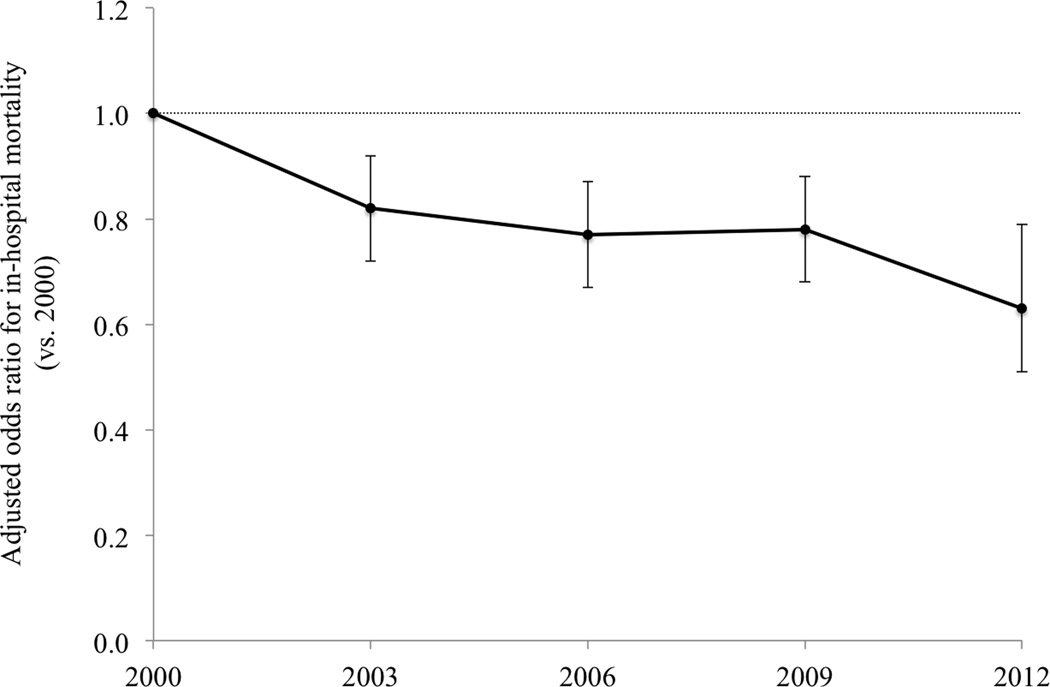
Figure 2. Adjusted odds ratio of in-hospital mortality in in U.S. children hospitalized for infectious disease, 2000–2012.
Models were adjusted for patient and hospital characteristics. The reference year is 2000. Error bars represent the 95% confidence interval. From 2000 to 2012, the adjusted OR significantly decreased (OR for comparison of 2012 with 2000, 0.63; 95%CI, 0.51–0.79; P<0.001).

