
Fig 1. Representation of six clusters after ascending hierarchical clustering analysis.
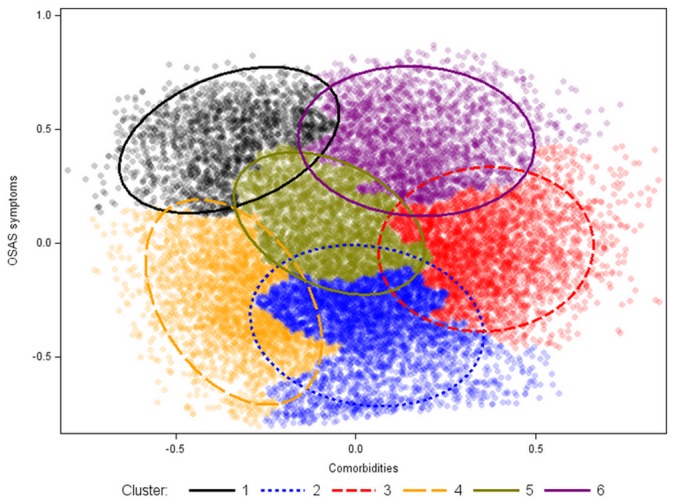
Axes correspond to individual coordinates for the two main dimensions of the multiple correspondence analysis. Cluster 1: the young symptomatic. Cluster 2: the old obese. Cluster 3: the multi-disease (MD) old obese. Cluster 4: the young snorers. Cluster 5: the drowsy obese. Cluster 6: the MD obese symptomatic.