FIGURE 6.

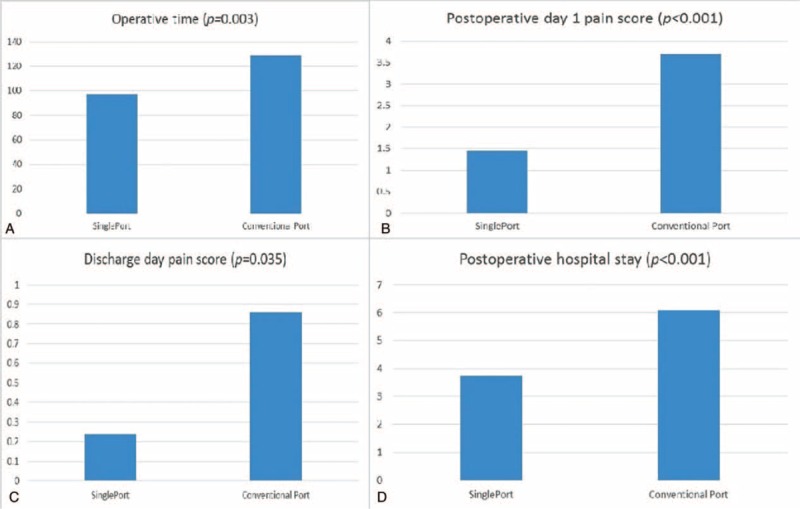
Comparisons between single-port and multiport group: (A) operative time, (B) postoperation day 1 pain score, (C) discharge day pain score, and (D) postoperation hospital stay after propensity scores matching.

Comparisons between single-port and multiport group: (A) operative time, (B) postoperation day 1 pain score, (C) discharge day pain score, and (D) postoperation hospital stay after propensity scores matching.