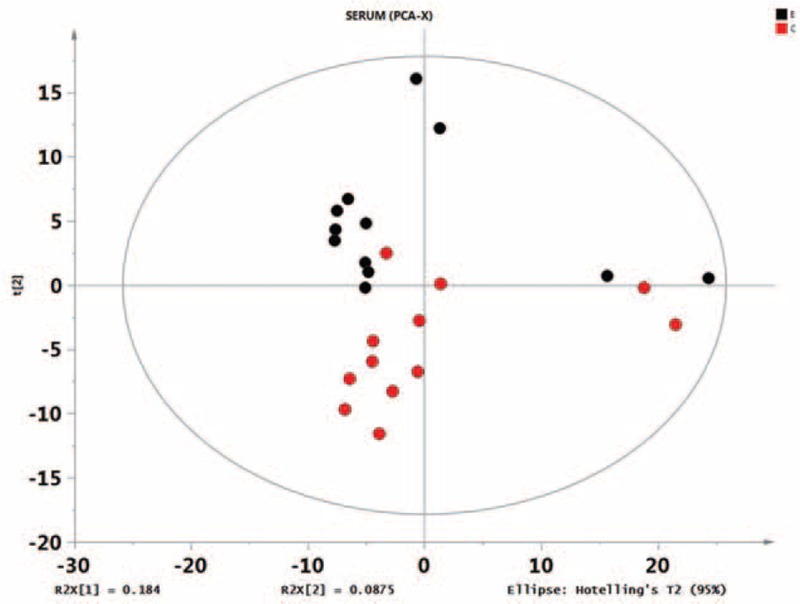
FIGURE 1.

Score plot of the principal components analysis model obtained from E and C. The principal components analysis score plot of the raw data samples is an overall presentation of the distribution. As can be observed from the scores, each group of samples can be substantially differentiated; some groups may be indistinguishable from others by subsequent discriminant analysis. Overall, these data are worthy of further study.
