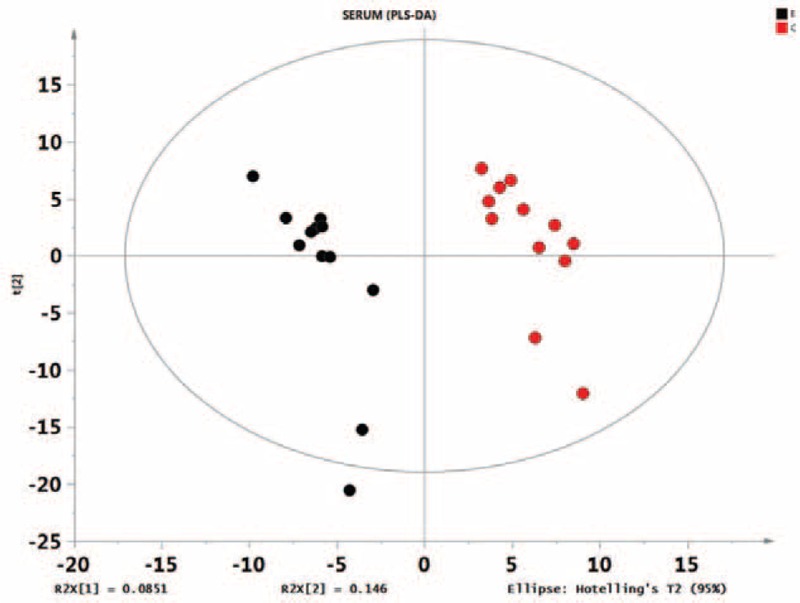
FIGURE 2.

Score plot of the PLS-DA model obtained from E and C. The PLS-DA scores are shown in Figure 2 (horizontal axis shows the first principal component scores, with t [1] represented; vertical axis shows the second principal component scores, with t [2] represented). The values of R2X (interpretable variable model) and R2Y (which is explained by models of supervision) are near 1, which shows that the PLS-DA model can well explain the differences between the 2 groups. The permutation test intercept (R2 = 0.889, Q2 = 0.0694) could very well reflect the validity of the model, indicating that the basic data are not overfit. PLS-DA, partial least squares-discriminant analysis.
