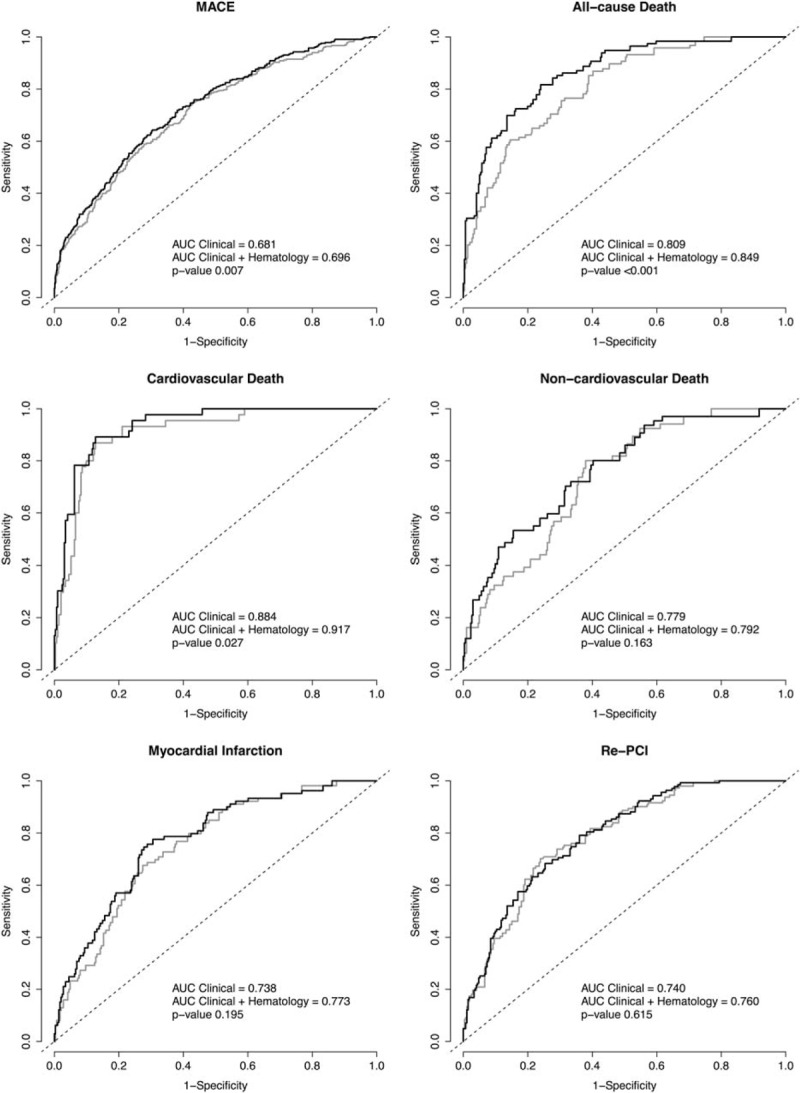
FIGURE 1.

. ROC curves of models for a clinical model with and without hematological parameters P values are given for difference between the area under the curve (AUC) of the clinical model plus hematological parameters (black line) as compared with the clinical model only (gray line). The hematological parameters added to the model are as stated in Table 3.
