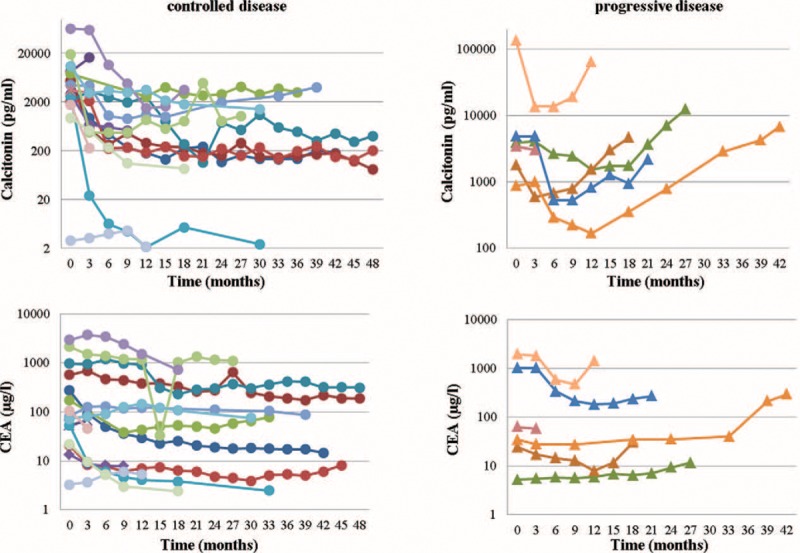
FIGURE 1.

Time curves (of every patient) for calcitonin (CTN) and carcinoembryonic antigen (CEA) for patients with controlled (stable disease or partial response; left) or progressive disease (right). Almost all patients display an initial decline in serum tumor markers after initiation of treatment with vandetanib, whereas the patients with long-term disease control just present with transient fluctuations in CTN and CEA levels (left column), the subjects with true progressive disease experience a continuous rise in tumor markers (right column). This distinction is more prominent for CTN than for CEA.
