
FIGURE 2.
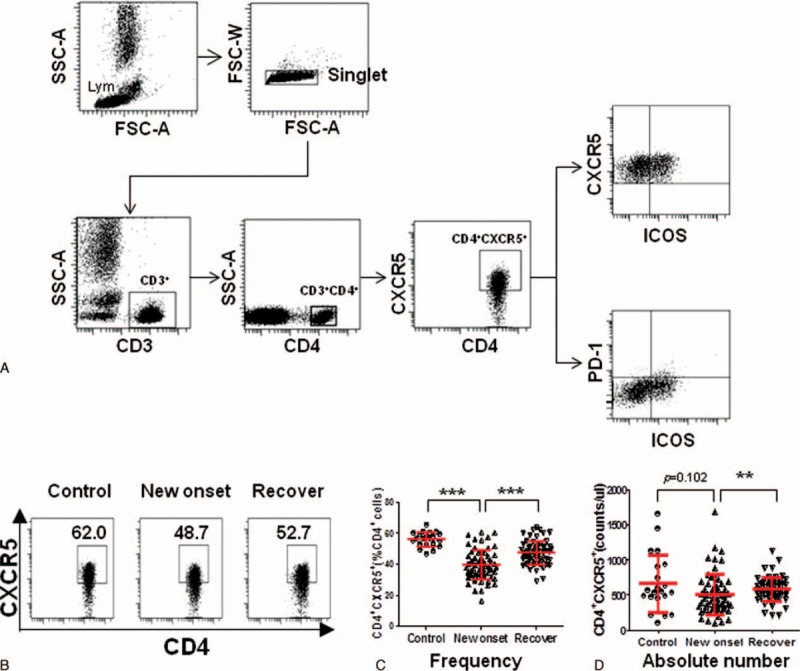
The CD4+CXCR5+ Tfh cells were not significantly changed in the peripheral blood of IM patients. A, Representative dot plots of CD4+CXCR5+, CD4+CXCR5+ICOS+, and CD4+CXCR5+ICOS+PD-1+ cells and gating criteria from the peripheral blood of IM patients are shown. Values in the upper right quadrant correspond to the percentage of CD4+CXCR5+, CD4+CXCR5+ICOS+ cells, or CD4+CXCR5+ICOS+PD-1+ Tfh cells. We used isotype controls to determine the positive cells, and all the values are gated on the CD4+cells. B, Representative dot plots of CD4+CXCR5+ Tfh cells among the healthy controls, new onset IM patients, and after antiviral treatment IM patients are shown. C, The percentage of CD4+CXCR5+ Tfh cells was compared among the 21 healthy controls, 61 new onset IM patients, and 61 after antiviral treatment IM patients. D, The absolute number of CD4+CXCR5+ Tfh cells was compared among the 21 healthy controls, 61 new onset IM patients, and 61 after antiviral treatment IM patients. Each data point represents an individual subject. The bars indicate the mean values. ∗∗P < 0.01, ∗∗∗P < 0.001, Mann–Whitney U test.