
FIGURE 3.
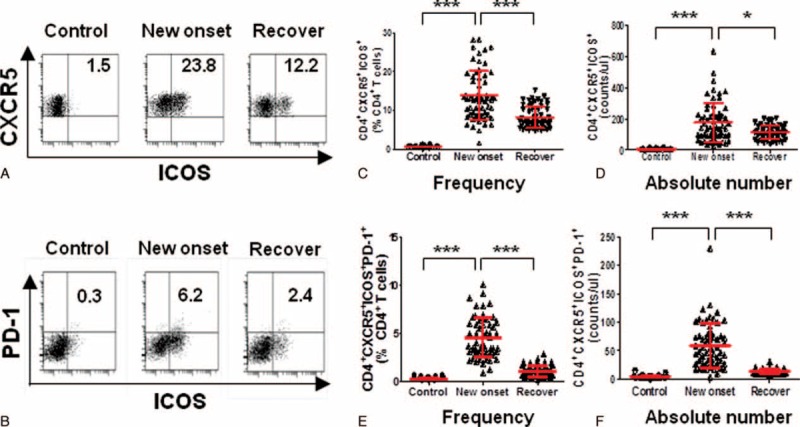
The CD4+CXCR5+ICOS+ and CD4+CXCR5+ICOS+PD1+ cells were increased in the peripheral blood of IM patients. Representative dot plots of CD4+CXCR5+ICOS+ (A), CD4+CXCR5+ICOS+PD1+ (B) cells among the 21 healthy controls, 61 new onset IM patients, and 61 after antiviral treatment IM patients are shown. The frequency and absolute number of CD4+CXCR5+ICOS+ (C, D), CD4+CXCR5+ICOS+PD1+ (E, F) cells was compared among the 21 healthy controls, 61 new onset IM patients, and 61 after antiviral treatment IM patients. Each data point represents an individual subject. The bars indicate the mean values. ∗P < 0.05, ∗∗∗P < 0.001. Mann–Whitney U test.