
FIGURE 4.
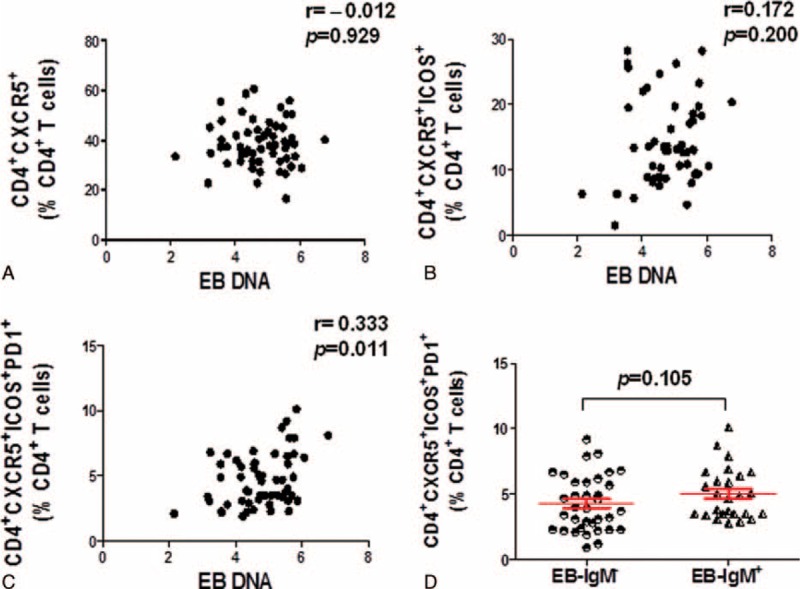
The percentage of CD4+CXCR5+ICOS+PD1+ Tfh cells was significantly correlated with the EB DNA load in IM patients. The correlation between the percentage of CD4+CXCR5 (A), CD4+CXCR5+ICOS+ (B), CD4+CXCR5+ICOS+PD-1+ (C) T cells with the log value of EB DNA load in PBMC of IM patients (n = 57), respectively. D, The percentage of CD4+CXCR5+ICOS+PD-1+ Tfh cells was compared with the 35 EB-IgM negative and 26 EB-IgM positive IM patients. Mann–Whitney U test.