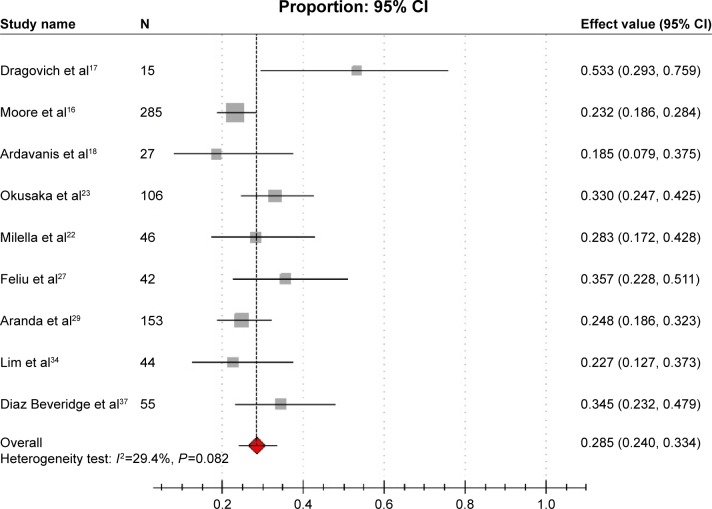
Figure 4.
Forest plot of meta-analysis on 1-year survival rate.
Notes: The gray squares indicate the 1-year survival rate of each study; the red square indicates the pooled overall 1-year survival rate of all the studies; the transverse line indicates the 95% CI.
Abbreviation: CI, confidence interval.

