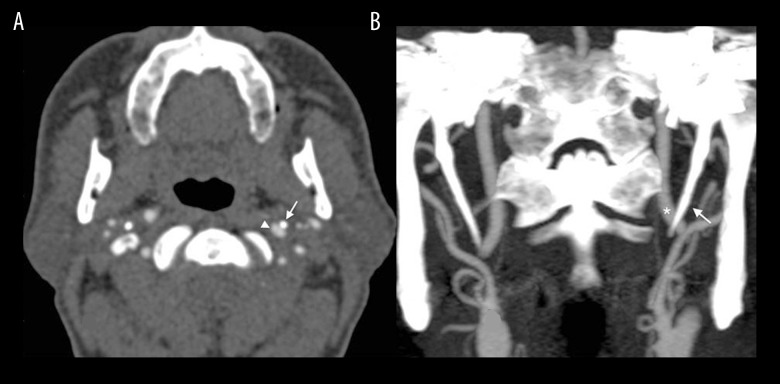
Figure 1.
(A) The contrast-enhanced MDCT angiography shows the styloid process causing a light pressure on the left ICA (arrowhead: ICA, arrow: styloid process). (B) Bilateral elongated styloid processes are seen on the coronal section MIP (Maximum Intensity Projection) images. (star: ICA, arrow: styloid process).

