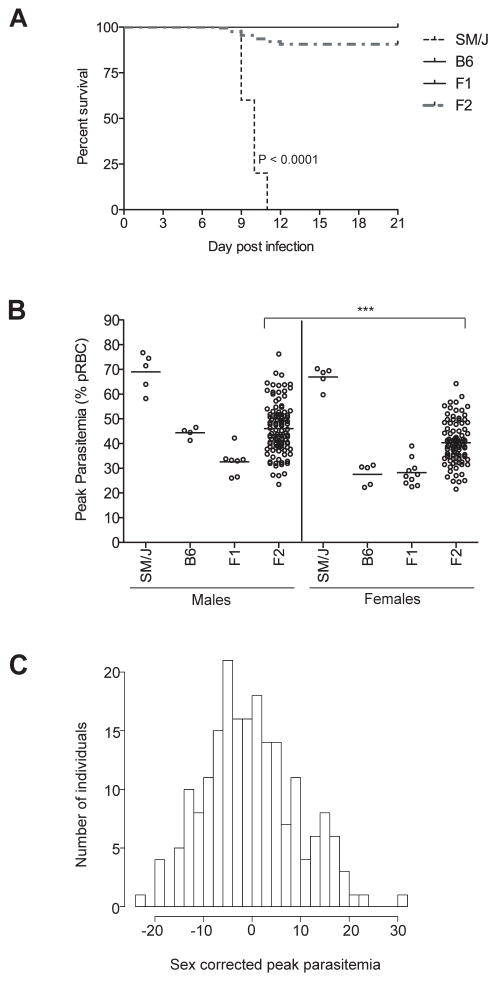
Figure 2. Segregation analysis of susceptibility to P. chabaudi chabaudi AS infection in [SM/J x C57BL/6J]F1 and F2 mice.
17 F1 and 201 F2 animals as well as parental controls were infected i.v. with 105 parasitized RBC, and daily parasitemia (expressed as percentage of parasitized RBC) as well as survival from infection were recorded. (A) Kaplan-Meier survival curve. Survival curves were compared by a Log-rank test and the median survival of SM/J was found to be significantly different from C57BL/6J (P<0.0001). (B) The peak of parasitemia is shown separately for males and females. Each circle represents one mouse. Statistical significance between F2 males and females (two-tailed Mann-Whitney test) is indicated by stars: ***P<0.0001. (C) Distribution of peak parasitemia in the entire F2 population after regression of peak parasitemia levels to a gender-specific mean.

