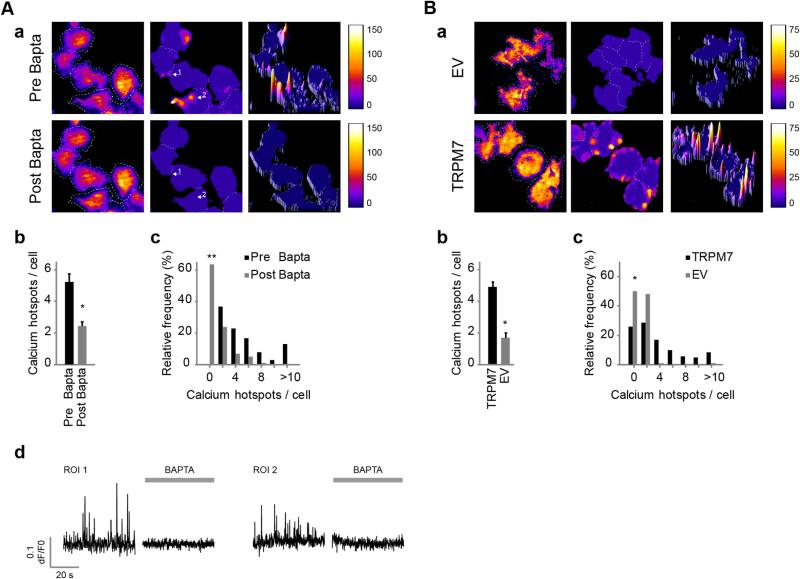
Fig. 2.
Ca2+ sparking requires Ca2+ influx and correlates with TRPM7 expression levels. (A) N1E-115/TRPM7 cells loaded with Oregon Green 488 BAPTA-1-AM and EDTA-AM were imaged before and after the application of BAPTA. (a) Left: input image; middle and right, 2-D and 3-D heatmaps, respectively. Representative heatmaps of Ca2+ spark formation over time before (top) and after (bottom) application of BAPTA are depicted. For interpretation of heatmaps, see the legend of Fig. 1C and the text. (b) Average number of Ca2+ hotspots per cell before and after application of BAPTA (n = 101 [pre] and n = 37 [post], p < 0.001 versus pre; Mann–Whitney U-test, two-tailed). (c) Frequency histogram (n = 101, versus pre, McNemar's test for paired proportions, two-tailed). (d) Ca2+ spark traces of representative Ca2+ hotspots (arrows in a) before (left) and after (right) BAPTA treatment. (B) N1E-115/TRPM7 cells were compared to their empty-vector controls with 3-fold lower TRPM7 expression. (a) Representative heatmaps of Ca2+ spark activity. (b) Mean number of Ca2+ hotspots per cell that showed Ca2+ sparking (n = 58 [N1E-115/EV] and n = 202 [N1E-115/TRPM7], p < 0.001; Mann–Whitney U-test, two-tailed). (c) Frequency distribution of sparking activity (n = 116 [N1E-115/EV], and n = 272 [N1E-115/TRPM7], p < 0.001; Fisher's exact test, two-tailed). Data in this figure represent mean ± SEM of at least 5 independent experiments. *p < 0.001 and **p < 0.0001.

