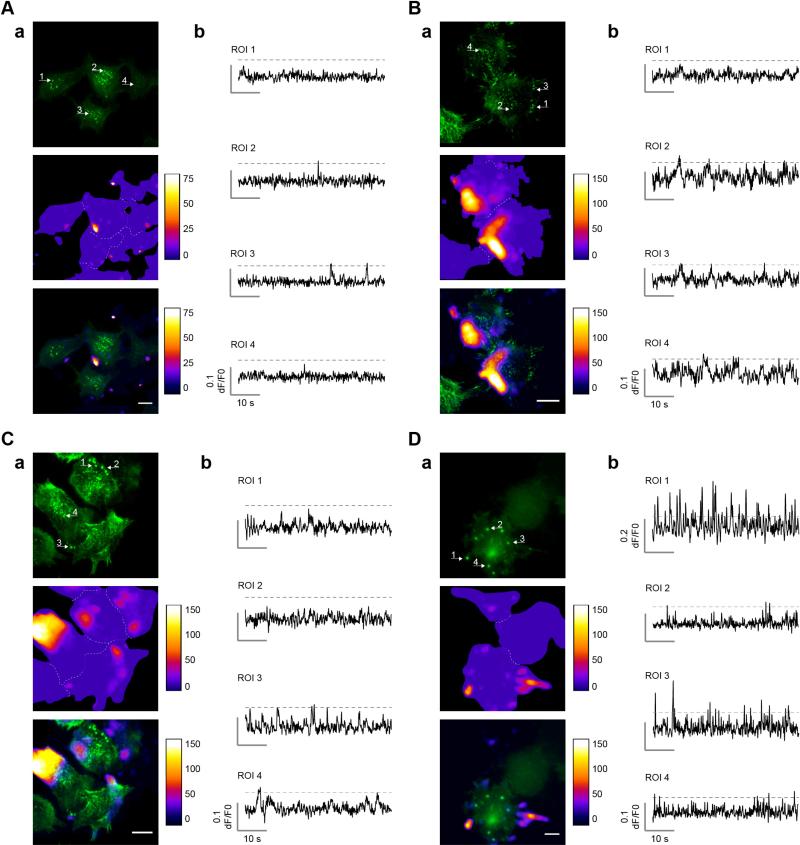
Fig. 4.
Ca2+ hotspots do not localize specifically to invadosomes. (A)–(D) Four examples demonstrating the distribution of Ca2+ hotspots and invadosomes in N1E-115/TRPM7 cells. Invadosomes are visualized as bright actin dots, labeled with RFP-actin or Lifeact-dsRed (here in green). Shown in each panel is actin (top), Ca2+ hotspots (middle) and overlay (bottom). Please note that the minimum value of the LUT for the Ca2+ hotspot image in the overlay was adjusted to improve visualization of colocalization with invadosomes. Arrows indicate location of the Ca2+ traces in (b). In (A) Ca2+ hotspots are primarily located in the periphery, away from central invadosomes. In (B) Ca2+ hotspots appear along one side of the cell and are clearly excluded from invadosomes. In (C) several neighboring peripheral invadosomes (ROI 1 + 2) do not colocalize with Ca2+ hotspots. In (D) two peripheral invadosomes overlap with highly active Ca2+ hotspots (ROI 1 + 3), whereas others are mostly silent (ROI 2 + 4). As detailed in the text, statistical analysis reveals no significant colocalization of Ca2+ hotspots with invadosomes; thus, panels A–C are representative for the vast majority of observations whereas panel D presents a single outlier where some colocalization seems to occur. Scale bar = 20 μm.

