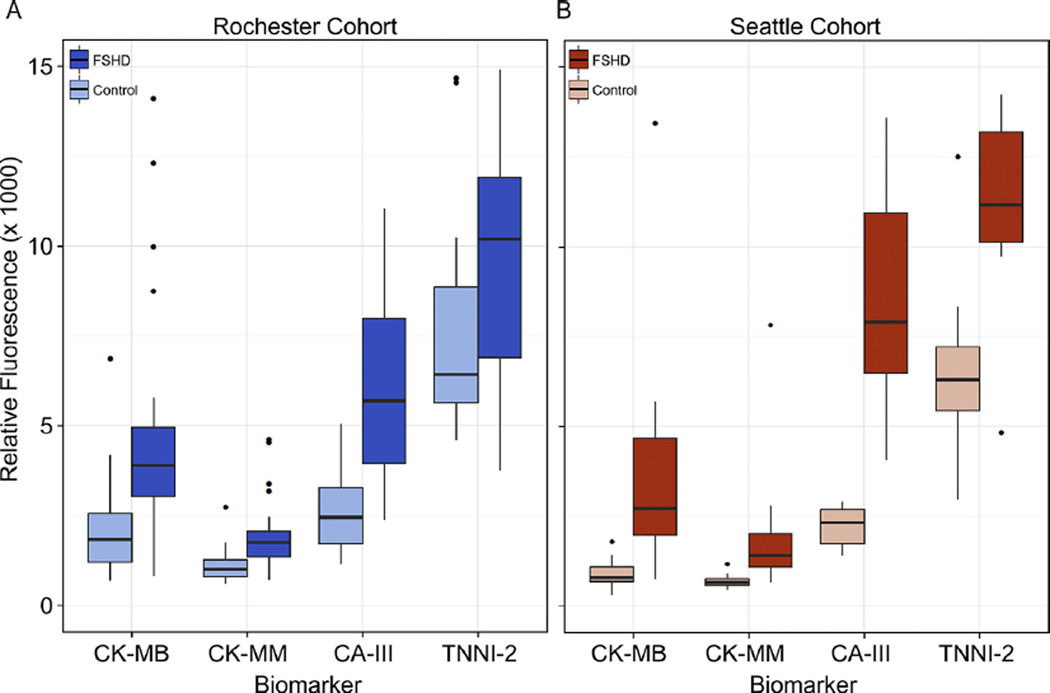
Fig. 1.
Biomarker concentrations in controls and FSHD-affected subjects from the Rochester and Seattle cohorts. Box plots (25th–75th percentile) and whiskers (Tukey’s method) showing comparisons of plasma concentrations for each of four biomarkers in control and FSHD-affected subjects. The black bar indicates median value, outliers (more or less than 3/2 times the upper and lower quartiles) are shown as single dots. (A) Rochester cohort with control group in light blue and FSHD group in dark blue. (B) Seattle cohort with control group in light red and FSHD group in dark red.

