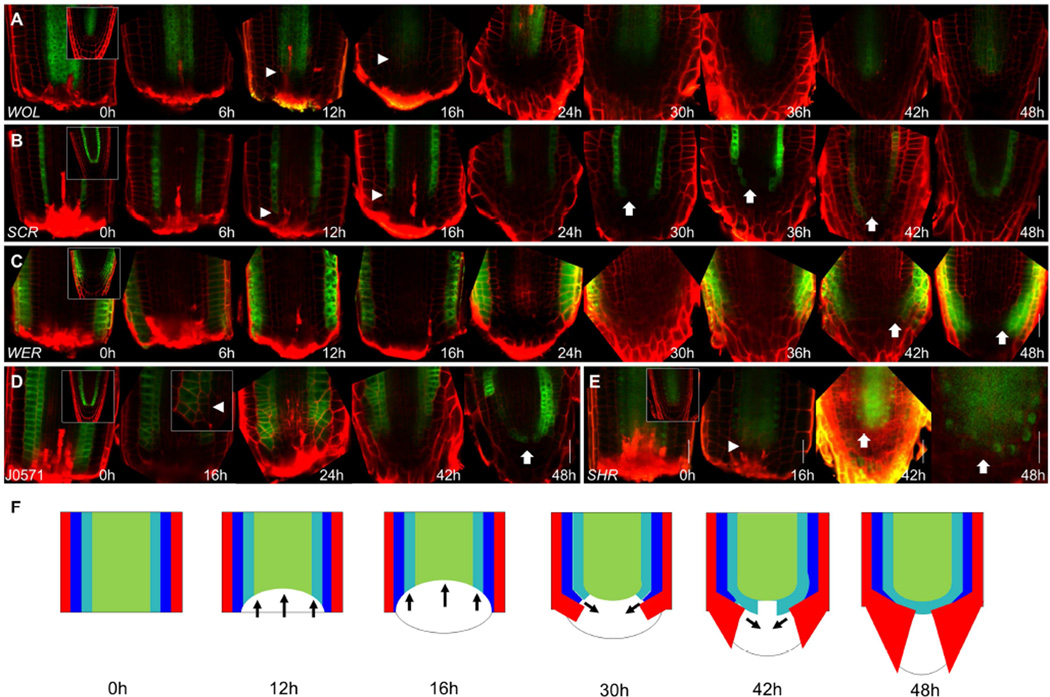
Figure 2. Dynamics of loss and recovery of proximal identities.
A–E) Confocal images of WOL:GFP (A), SCR:YFP (B), WER:GFP (C), J0571 (D) and SHR:SHR:GFP (E) during regeneration. Insets at 0h show uncut roots. Arrowheads mark the receding edge of the proximal identity markers. Arrows mark recovery of identity markers. Inset at (D) 16hpc shows a high magnification of the identity recession region. F) Illustration summarizing identity transition during regeneration. Red - epidermis/lateral root cap; blue – cortex; cyan – endodermis; green – stele. Arrows indicate the directions of identity recession and recovery. Scale bars are 20µm.

