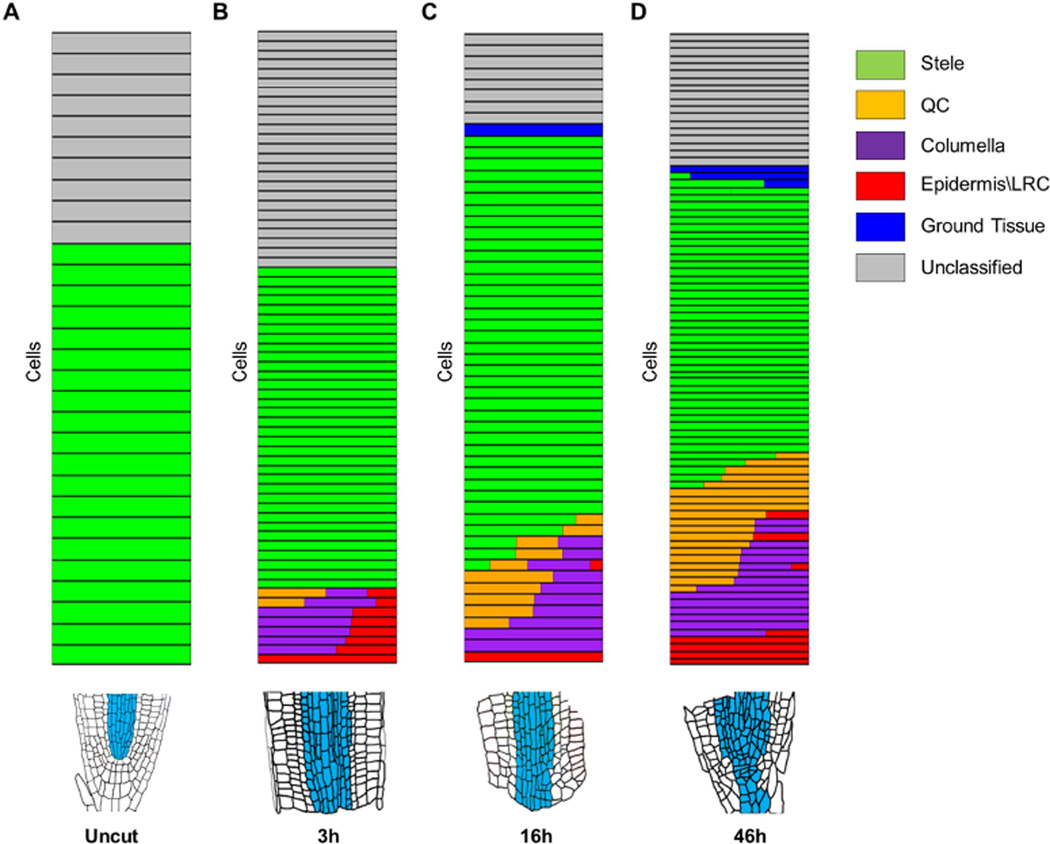
Figure 3. Identity of single cells isolated from regenerating roots.
A–D) Relative cell identity in individual cells isolated from uncut (A) and 3hpc (B), 16hpc (C) and 46hpc (D). Each row represents a single cell. Identity is shown as a color-coded bar consisting of the normalized ICI score for each tissue type. Multiple color bars in a single row indicate mixed-identity within a single cell. Blue sectors in root illustrations (bottom) represent the domains from which single cells were isolated.

