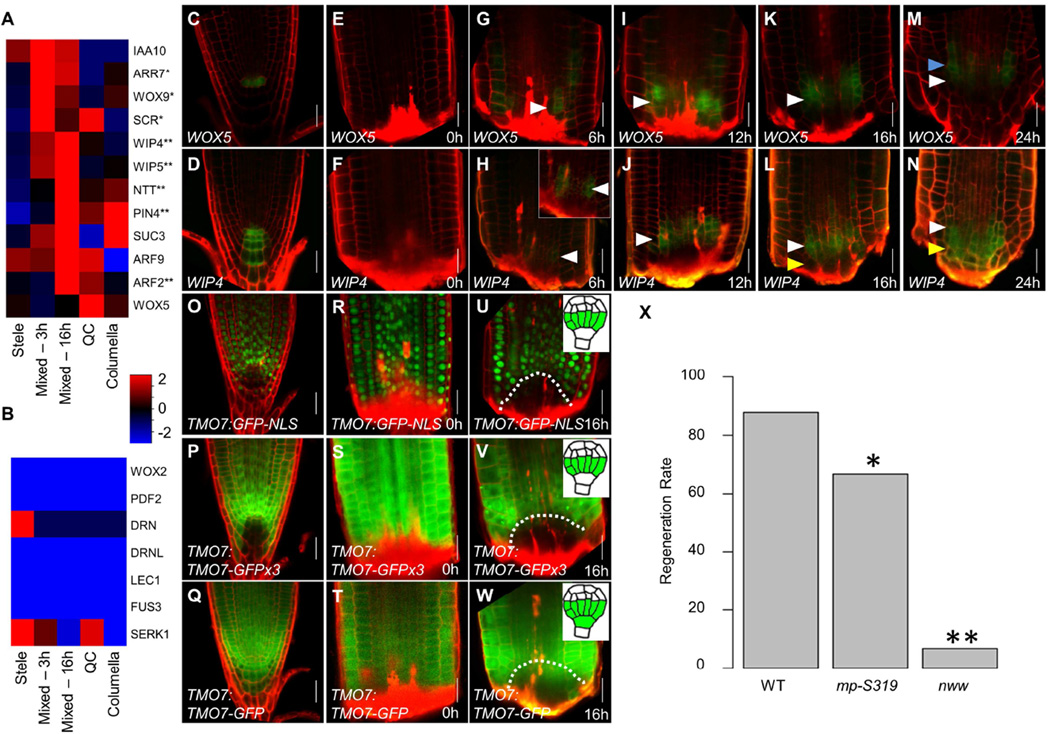
Figure 4. Proximodistal domain separation resembles embryonic hypophysis division.
A–B) Mean expression values of known hypophysis (A) or embryonic but non-hypophysis (B) expressed genes in single cells grouped according to their identity. * and ** marks significant upregulation at 3h or 16h, respectively (p<0.05; Wilcoxon test). C–N) Confocal images of WOX5 (C,E,G,I,K,M) and WIP4 (D,F,H,J,L,N) reporters over the first 24 hours of regeneration. Blue, white, and yellow arrowheads mark the forming proximal, overlapping, and distal domains, respectively. Inset shows magnified and gain-enhanced GFP signal. O–W) Confocal images of transcriptional (O–U) and translational non-mobile (P–V) and mobile (Q–W) reporters of TMO7. Inset at 16h show the embryonic expression of each reporter. Dotted line marks the region of identity loss. X) Regeneration rate of mutants defective in hypophysis division. * p=0.02; ** p<1E-10; χ2-test. Scale bars are 20µm.

