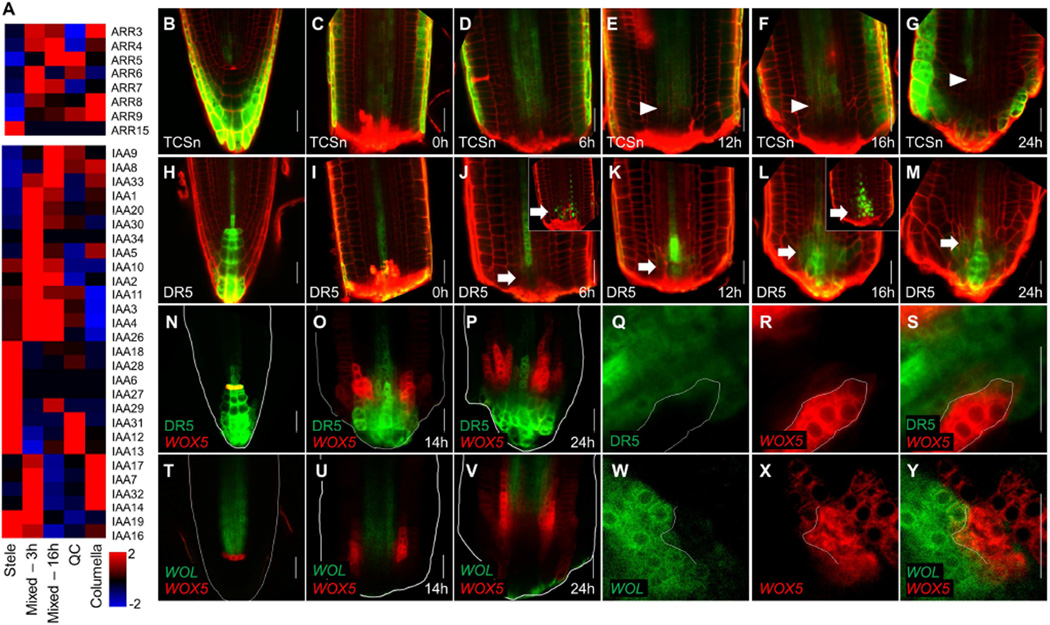
Figure 5. Expression of hormonal response markers during proximodistal domain separation.
A) Mean expression values in single cells, grouped by identity, of A-class ARR (top) or AUX/IAA (bottom) gene families. B–M) Expression of the cytokinin marker TCSn (B–G) and auxin marker DR5 (H–M) during regeneration. Arrowheads mark the recession of the TCSn signal. Arrows mark induction of DR5. Insets in (J) and (L) show expression of the rapid maturing DR5rev:NLS-3xVenus at the corresponding time points. N–P) Dual marker expression of DR5 (green) and WOX5 (red) before cutting (N) and at 14hpc (P) or 24hpc (P). Q–S) An invading sector of WOX5 (red) expression in the DR5 (green) domain in single channel (Q–R) and overlay (S) at 14hpc. T–Y) Confocal image of WOL (green) WOX5 (red) plants, before cut (T) and at 14hpc (U) and 24hpc (V), including high magnification of a WOX5 invading sector (W–Y) at 14hpc. Scale bars are 20µm.

