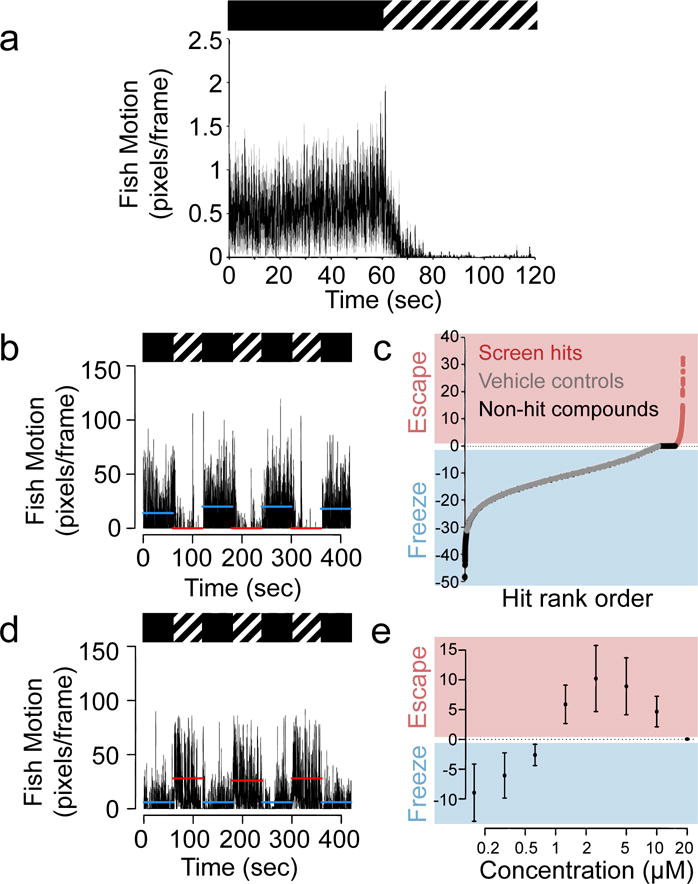
Figure 1. High-throughput chemical screen for compounds that disrupt zebrafish freezing behavior.

(a) Aggregate motor activity (in pixels per frame) over time from one 7 dpf larva per well of a 96-well plate during a two-minute experiment, n = 48 larvae. Boxes above mark 1 min intervals when the fish are in darkness (black box) or strobe light (hashed box). Data are shown as mean (black line) ± s.d. (gray regions) and are representative of three independent experiments. (b) Motor activity from all larvae in a single control, vehicle (DMSO) treated well during the SLR chemical screen. Horizontal lines represent 1 min averages for motion in darkness (blue) or in strobe light (red), n = 10 larvae. Data are representative of 2,000 wells in 125 independent experiments. (c) High-throughput screen results from >10,000 compounds. The y-axis represents the freezing index (a measure of the difference in motion between strobe light and dark periods, see Online Methods) for each well tested. The x-axis represents well position (for 12,000 wells, n = 10 larvae per well) ranked by freezing index value. Wells with test compounds are labeled either pink (hit compounds, freezing index > 0) and black (non-hit compounds, freezing index ≤ 0). Negative control wells (DMSO vehicle alone) are labeled in gray. (d) Fish motion during the strobe assay in wells treated with compound 1, n = 10 larvae. Data are representative of 36 wells from 3 independent experiments. (e) Dose curves showing the degree of behavioral switching. Data are presented as mean of the freezing index ± s.d. (n = 12 wells per dose) and are representative of 3 independent experiments.
