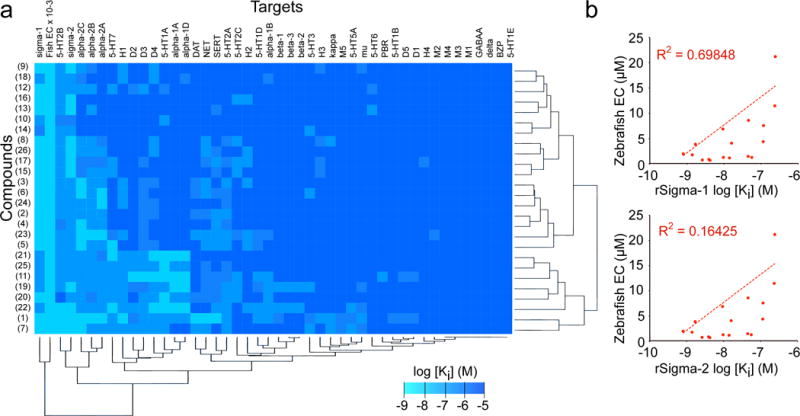
Figure 3. Target profiling.

(a) Heat map depiction of in vitro mammalian target binding assay results across 45 candidate targets. Small molecules were computationally clustered by target profile similarity (vertical brackets) and targets were clustered by chemical binding profiles (horizontal brackets). Legend shows Ki values in log scale (range ≥ 10 μM to 1 nM, with the exception of the ‘fish activity’ column where the EC values were scaled for comparison, range 100 to 0.1 μM). (b) Correlation plots of compound potency in the zebrafish strobe assay versus in vitro potency in simga-1 or -2 binding assays, as indicated. Each point represents a different compound in the finazine class. Regression line and R2 value was calculated using Microsoft Excel. For all Ki determinations, n = 3 replicates per dose over a 12 dose range. For zebrafish assays n = 12 wells per dose over a 12 dose range.
