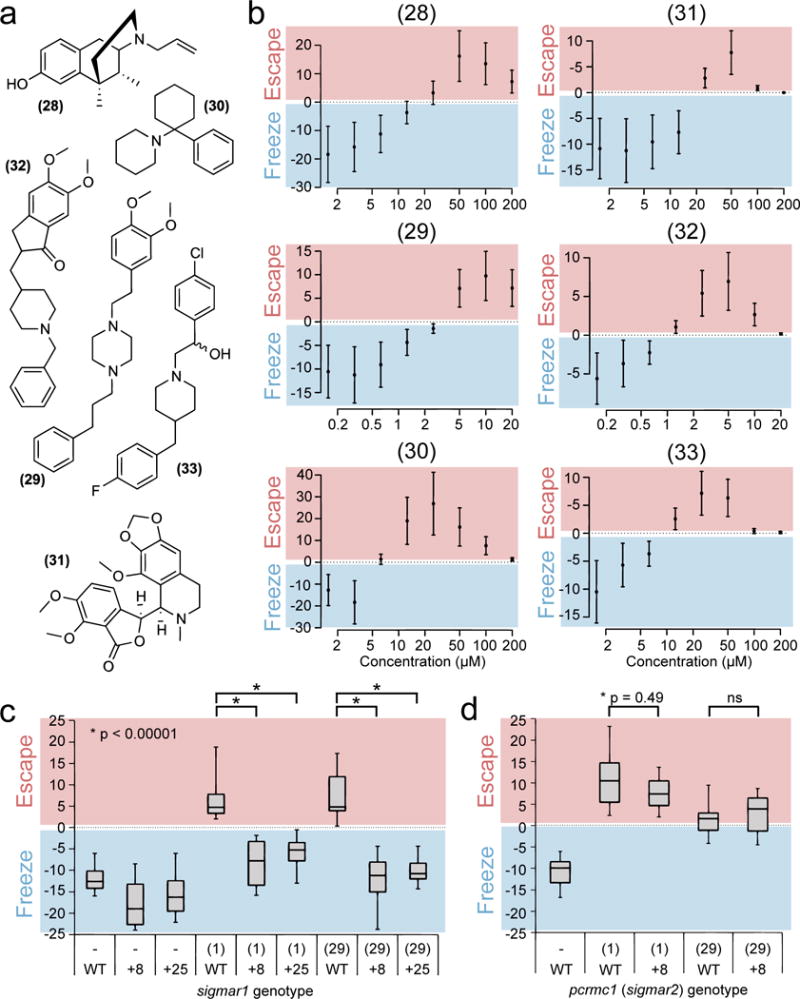
Figure 4. Sigma-1 is a functional target of finazine.

(a) Chemical structure of known sigma-1 ligands: (+)-SKF-10,047 (28), cutamesine (29), phencyclidine (30), noscapine (31), eliprodil (32) and donepezil (33). (b) Dose curves showing the degree of behavioral switching, measured by the freezing index. Data represent mean ± s.d. for n = 12 wells per dose and are representative of three independent experiments. (c) Full-range boxplots showing all data from n = 12 wells of wild-type sibling (WT) or homozygous mutant sigmar1 fish (8 or +25) treated with 10 μM scopolamine and either DMSO (−), 5 μM finazine or 10 μM cutamesine. Boxes represent the interquartile range, whiskers represent maximum and minimum values. Data are representative of two independent experiments. (d) Same as (c), but with wild-type sibling (WT) or homozygous mutant pgrmc1 fish (+8). Statistical significance was calculated using a student’s t-test (2-tailed, unpaired, unequal variance).
