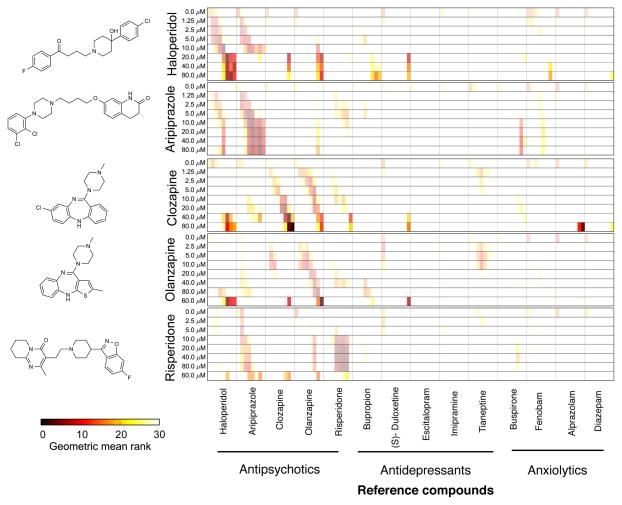
Figure 2. Antipsychotic drugs cause specific behavioral profiles in the test battery.
Chemical structures (left) of each reference compound queried and heat maps (right) showing a matrix comparing queries (rows) and reference compounds (columns). Note that each cell of the matrix is divided into eight segments representing increasing concentrations of the indicated reference compound (left to right). Heat map color represents the phenotypic similarity ranking as indicated in the color bar (see Methods). Color saturation represents the magnitude of the behavioral distance from DMSO controls, such that darker colors represent larger magnitudes. Each condition (compound & concentration) is the average of 36 time-series obtained from 36 wells screened over 3 daily experiments of 12 wells each. Each well contained 8 larvae.

