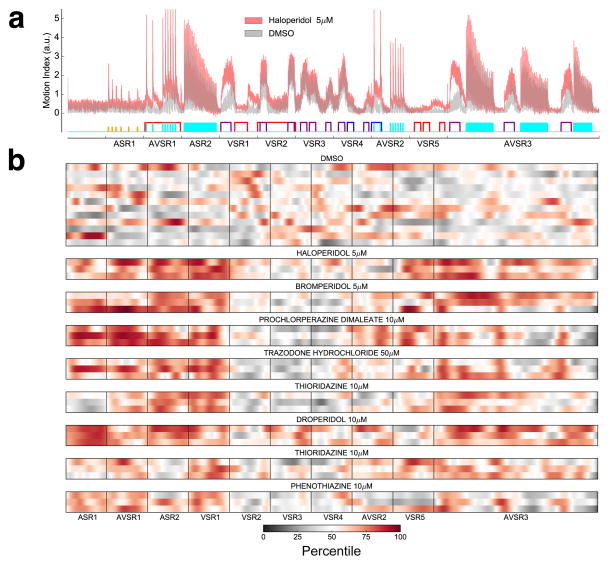
Figure 3. Haloperidol causes complex behavioral phenotypes in the zebrafish.
(a) Average MI of animals treated with haloperidol (5μM) or DMSO (n= 48 wells per condition). (b) Heat maps showing the effect of indicated antipsychotic compounds on zebrafish motor activity. For every drug treatment, each of the three rows represents a single well (8 larvae). The x-axis indicates time and specific assays administered as shown in panel a. Color indicates percentile ranking of the motion index relative to DMSO controls (8 wells, each containing 8 larvae).

