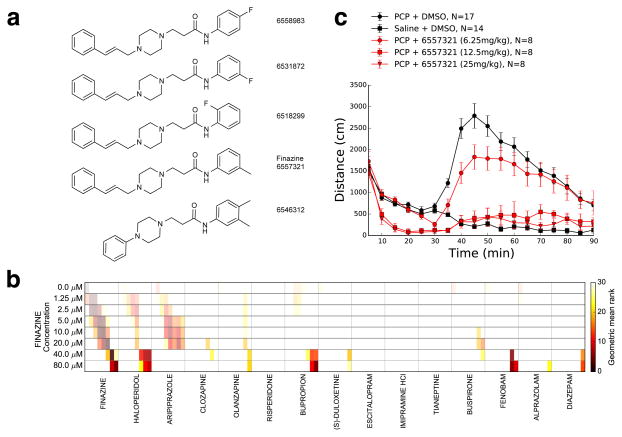
Figure 5. Finazine phenocopies haloperidol in zebrafish and in mice.
(a) The five compound structures in the finazine cluster (arrow). (b) Heat map showing the phenotypic similarity rank of 14 psychiatric drugs (columns) relative to the finazine query at each indicated concentration (rows). Each cell in the matrix is divided into 8 segments to represent different concentrations, and similarity rank is indicated in the color bar. (c) Plot of mouse locomotor activity as measured by distance traveled (y-axis) during the psychostimulant (PCP)-induced locomotor assay. Different treatments are as indicated; DMSO indicates the vehicle control and 6557321 indicates finazine. PCP was administered at 30 min (arrow). Values are mean ± sem.

